AWS Cost Explorer and Budgets: Controlling Cloud Spend
AWS bills monthly and surprises quarterly. A developer enables NAT Gateway logging in a test environment; nobody notices until the bill arrives with an extra $400 in data processing charges. An EC2 instance left running over a three-day holiday weekend adds $180 nobody budgeted for. AWS Cost Explorer and Budgets exist to catch these situations — not after the fact, but before the bill closes.
Cost Explorer is the analysis tool: filter spend by service, account, tag, region, and time range, then build reports that show where money is actually going. Budgets is the alerting layer: set a threshold, get notified when you’re trending over it, and optionally trigger automated actions to stop the bleeding. Used together they give you both visibility and guardrails.
Cost Explorer: Finding Where the Money Goes
Cost Explorer costs $0.01 per API request. The console is free. For routine cost analysis, the console is sufficient. For automated reporting or dashboards, budget API usage carefully — a script that runs hourly against Cost Explorer could easily generate $7/day in API costs.
The most useful starting point is the Monthly Costs by Service view. This shows which services account for most of your spend. For most accounts, EC2, RDS, and data transfer dominate. Once you know which services are expensive, use filters to drill into specifics.
# Get last month's costs by service via CLI
aws ce get-cost-and-usage \
  --time-period Start=2026-06-01,End=2026-07-01 \
  --granularity MONTHLY \
  --metrics BlendedCost \
  --group-by Type=DIMENSION,Key=SERVICE \
  --query 'ResultsByTime[0].Groups[*].{Service:Keys[0],Cost:Metrics.BlendedCost.Amount}' \
  --output table | sort -k2 -rn

# Daily costs for the current month (useful for spotting anomalies)
aws ce get-cost-and-usage \
  --time-period Start=2026-07-01,End=2026-07-10 \
  --granularity DAILY \
  --metrics UnblendedCost \
  --query 'ResultsByTime[*].{Date:TimePeriod.Start,Cost:Total.UnblendedCost.Amount}' \
  --output table

# Filter to specific service and break down by resource tag
aws ce get-cost-and-usage \
  --time-period Start=2026-06-01,End=2026-07-01 \
  --granularity MONTHLY \
  --metrics BlendedCost \
  --filter '{"Dimensions":{"Key":"SERVICE","Values":["Amazon EC2"]}}' \
  --group-by Type=TAG,Key=Environment \
  --query 'ResultsByTime[0].Groups[*].{Tag:Keys[0],Cost:Metrics.BlendedCost.Amount}' \
  --output table
The tag filter query is where cost allocation tags matter. If your EC2 instances aren’t tagged with Environment, Team, or Project, Cost Explorer can only tell you EC2 costs the account as a whole — not which team or project is responsible for what portion.
Cost Allocation Tags
Cost allocation tags must be explicitly activated in the Billing console before they appear in Cost Explorer. Tags exist on resources the moment you add them, but they don’t appear in cost data until activated, and the activation only takes effect going forward (no historical backfill).
# Activate cost allocation tags (must run as billing/root account)
aws ce update-cost-allocation-tags-status \
  --cost-allocation-tags-status '[
    {"TagKey": "Environment", "Status": "Active"},
    {"TagKey": "Team", "Status": "Active"},
    {"TagKey": "Project", "Status": "Active"},
    {"TagKey": "CostCenter", "Status": "Active"}
  ]'

# List currently active cost allocation tags
aws ce list-cost-allocation-tags \
  --status Active \
  --query 'CostAllocationTags[*].TagKey'
A practical tagging strategy that actually works: enforce tags with a Service Control Policy (SCP) that denies EC2, RDS, and Lambda creation without required tags. Retroactive tagging campaigns never complete — the right time to add a tag is resource creation. The same tag activation workflow applies to Bedrock AI workloads: tagging the IAM roles that invoke foundation models enables per-team and per-application breakdowns in CUR 2.0, which is covered in detail in this Bedrock IAM cost allocation guide.
// SCP to require Environment and Team tags on EC2 and RDS
{
  "Version": "2012-10-17",
  "Statement": [
    {
      "Sid": "RequireTagsOnEC2",
      "Effect": "Deny",
      "Action": ["ec2:RunInstances"],
      "Resource": "arn:aws:ec2:*:*:instance/*",
      "Condition": {
        "Null": {
          "aws:RequestTag/Environment": "true",
          "aws:RequestTag/Team": "true"
        }
      }
    }
  ]
}
Savings Plans Coverage and Utilization
Savings Plans give you discounted EC2 and Lambda pricing in exchange for a $/hour commitment. Cost Explorer has two reports specifically for monitoring commitment health:
Savings Plans Coverage: what percentage of eligible spend is covered by a savings plan. Low coverage means you’re leaving money on the table — you have eligible usage that isn’t being discounted.
Savings Plans Utilization: how much of your committed spend you’re actually using. Low utilization means you committed to more than you’re using — you’re paying for capacity you don’t consume.
# Get Savings Plans coverage for last 3 months
aws ce get-savings-plans-coverage \
  --time-period Start=2026-04-01,End=2026-07-01 \
  --granularity MONTHLY \
  --query 'SavingsPlansCoverages[*].{
    Period:TimePeriod.Start,
    Coverage:Coverage.CoveragePercentage,
    OnDemandCost:Coverage.OnDemandCost,
    SpendCoveredBySP:Coverage.SpendCoveredBySavingsPlans
  }' \
  --output table

# Get utilization (are you actually using what you committed to?)
aws ce get-savings-plans-utilization \
  --time-period Start=2026-06-01,End=2026-07-01 \
  --granularity MONTHLY \
  --query 'SavingsPlansUtilizationsByTime[*].{
    Period:TimePeriod.Start,
    Utilization:Utilization.UtilizationPercentage,
    UnusedCommitment:Utilization.UnusedCommitment
  }' \
  --output table
Target: coverage above 70%, utilization above 80%. If coverage is low, buy more savings plans. If utilization is low, you over-committed — wait for plans to expire before renewing at the same level.
Cost Anomaly Detection
Cost anomaly detection uses machine learning to identify unusual spend patterns and alert before they become large bills. It’s free to enable; you pay only for the SNS notifications it triggers.
# Create an anomaly monitor for all AWS services
aws ce create-anomaly-monitor \
  --anomaly-monitor '{
    "MonitorName": "AllServices",
    "MonitorType": "DIMENSIONAL",
    "MonitorDimension": "SERVICE"
  }'

# Create an alert subscription (fires when anomaly > $50 impact)
aws ce create-anomaly-subscription \
  --anomaly-subscription '{
    "SubscriptionName": "DailyAnomalyAlert",
    "MonitorArnList": ["arn:aws:ce::123456789012:anomalymonitor/MONITOR_ID"],
    "Subscribers": [
      {
        "Address": "arn:aws:sns:us-east-1:123456789012:cost-alerts",
        "Type": "SNS"
      }
    ],
    "Threshold": 50,
    "ThresholdExpression": {
      "Dimensions": {
        "Key": "ANOMALY_TOTAL_IMPACT_ABSOLUTE",
        "Values": ["50"],
        "MatchOptions": ["GREATER_THAN_OR_EQUAL"]
      }
    },
    "Frequency": "DAILY"
  }'

# View recent anomalies
aws ce get-anomalies \
  --date-interval Start=2026-07-01,End=2026-07-10 \
  --query 'Anomalies[*].{
    Service:AnomalyDetails.Service,
    Start:AnomalyStartDate,
    Impact:Impact.TotalActualSpend,
    ExpectedSpend:Impact.TotalExpectedSpend
  }' \
  --output table
Anomaly detection with a $50 threshold works well for most accounts. Set it too low and you get alert fatigue from expected seasonal variation; too high and small but sustained overages go unnoticed for weeks.
AWS Budgets
Budgets let you set cost or usage thresholds and get notified when you’re approaching or exceeding them. Four types of budgets cover different use cases:
# 1. Monthly cost budget with 80% and 100% alerts
aws budgets create-budget \
  --account-id 123456789012 \
  --budget '{
    "BudgetName": "Monthly-Total-Cost",
    "BudgetType": "COST",
    "TimeUnit": "MONTHLY",
    "BudgetLimit": {"Amount": "5000", "Unit": "USD"},
    "CostFilters": {},
    "CostTypes": {
      "IncludeTax": true,
      "IncludeSubscription": true,
      "UseBlended": false
    }
  }' \
  --notifications-with-subscribers '[
    {
      "Notification": {
        "NotificationType": "ACTUAL",
        "ComparisonOperator": "GREATER_THAN",
        "Threshold": 80,
        "ThresholdType": "PERCENTAGE"
      },
      "Subscribers": [{"SubscriptionType": "EMAIL", "Address": "[email protected]"}]
    },
    {
      "Notification": {
        "NotificationType": "FORECASTED",
        "ComparisonOperator": "GREATER_THAN",
        "Threshold": 100,
        "ThresholdType": "PERCENTAGE"
      },
      "Subscribers": [{"SubscriptionType": "SNS", "Address": "arn:aws:sns:us-east-1:123456789012:cost-alerts"}]
    }
  ]'

# 2. EC2 usage budget for a specific team (tag-filtered)
aws budgets create-budget \
  --account-id 123456789012 \
  --budget '{
    "BudgetName": "Platform-Team-EC2",
    "BudgetType": "COST",
    "TimeUnit": "MONTHLY",
    "BudgetLimit": {"Amount": "800", "Unit": "USD"},
    "CostFilters": {
      "TagKeyValue": ["Team$platform"],
      "Service": ["Amazon EC2"]
    }
  }' \
  --notifications-with-subscribers '[
    {
      "Notification": {
        "NotificationType": "ACTUAL",
        "ComparisonOperator": "GREATER_THAN",
        "Threshold": 90,
        "ThresholdType": "PERCENTAGE"
      },
      "Subscribers": [{"SubscriptionType": "EMAIL", "Address": "[email protected]"}]
    }
  ]'
The FORECASTED notification type is more useful than ACTUAL for month-end surprises. If spend is trending to exceed budget by 15% and the month is only half over, the forecasted alert fires with enough time to investigate and take action. Actual alerts only fire after you’ve already overspent.
Budget Actions
Budget actions automatically trigger responses when thresholds are exceeded. They can apply IAM policies, target EC2/RDS instances, or run an SSM automation document.
# Budget action: apply a restrictive IAM policy when 100% of budget is exceeded
aws budgets create-budget-action \
  --account-id 123456789012 \
  --budget-name Monthly-Total-Cost \
  --notification-type ACTUAL \
  --action-type APPLY_IAM_POLICY \
  --action-threshold '{"ActionThresholdValue": 100, "ActionThresholdType": "PERCENTAGE"}' \
  --definition '{
    "IamActionDefinition": {
      "PolicyArn": "arn:aws:iam::aws:policy/AWSDenyAll",
      "Roles": ["arn:aws:iam::123456789012:role/DeveloperRole"]
    }
  }' \
  --execution-role-arn arn:aws:iam::123456789012:role/BudgetActionsRole \
  --approval-model AUTOMATIC \
  --subscribers '[{"Type": "SNS", "Address": "arn:aws:sns:us-east-1:123456789012:cost-alerts"}]'
Budget actions are powerful enough to warrant caution. An action that stops all EC2 instances when a budget is exceeded would shut down production if the budget threshold is set too low or the wrong service is targeted. Start with approval-model: MANUAL — the action triggers a notification requiring human approval before executing. Switch to AUTOMATIC only after you’ve validated the thresholds and targets carefully.
Cost and Usage Report
The Cost and Usage Report (CUR) is the most granular billing data AWS provides. Every line item in your bill, at hourly or daily granularity, with resource IDs, tags, pricing dimensions, and savings plan discounts. CUR delivers to S3, where Athena can query it.
# Create a CUR report definition
aws cur put-report-definition \
  --report-definition '{
    "ReportName": "my-cur",
    "TimeUnit": "HOURLY",
    "Format": "Parquet",
    "Compression": "Parquet",
    "AdditionalSchemaElements": ["RESOURCES"],
    "S3Bucket": "my-cur-bucket",
    "S3Prefix": "cur/",
    "S3Region": "us-east-1",
    "AdditionalArtifacts": ["ATHENA"],
    "RefreshClosedReports": true,
    "ReportVersioning": "OVERWRITE_REPORT"
  }'
CUR with Athena is the foundation of serious FinOps work. Common queries:
-- Top 10 EC2 instances by cost last month
SELECT line_item_resource_id,
       resource_tags_user_name,
       SUM(line_item_unblended_cost) AS total_cost
FROM cur_database.cur_table
WHERE line_item_service_code = 'AmazonEC2'
  AND line_item_line_item_type = 'Usage'
  AND month = '7' AND year = '2026'
GROUP BY line_item_resource_id, resource_tags_user_name
ORDER BY total_cost DESC
LIMIT 10;

-- Data transfer costs by destination
SELECT line_item_usage_type,
       SUM(line_item_unblended_cost) AS cost,
       SUM(line_item_usage_amount) AS gb_transferred
FROM cur_database.cur_table
WHERE line_item_usage_type LIKE '%DataTransfer%'
  AND month = '7' AND year = '2026'
GROUP BY line_item_usage_type
ORDER BY cost DESC;
Data transfer costs are frequently the surprise item in bills. CUR is the only way to see exactly which resource is generating transfer charges and to which destination — the Cost Explorer UI aggregates data transfer in ways that obscure the source.
For EC2 right-sizing recommendations that feed directly into the budgeting decisions here, AWS Compute Optimizer surfaces which instances to resize before committing to savings plans. The AWS CloudTrail deep dive covers the audit trail for cost-related API calls — who enabled that expensive data event logging or launched that large instance.
Explore more like this

Aurora Serverless v2 + Bedrock: AI Database Queries in 2026
I connected Bedrock to our Aurora cluster last month. The first thing I asked it was “show me all customers who churned in Q1 but came back in Q2” —...
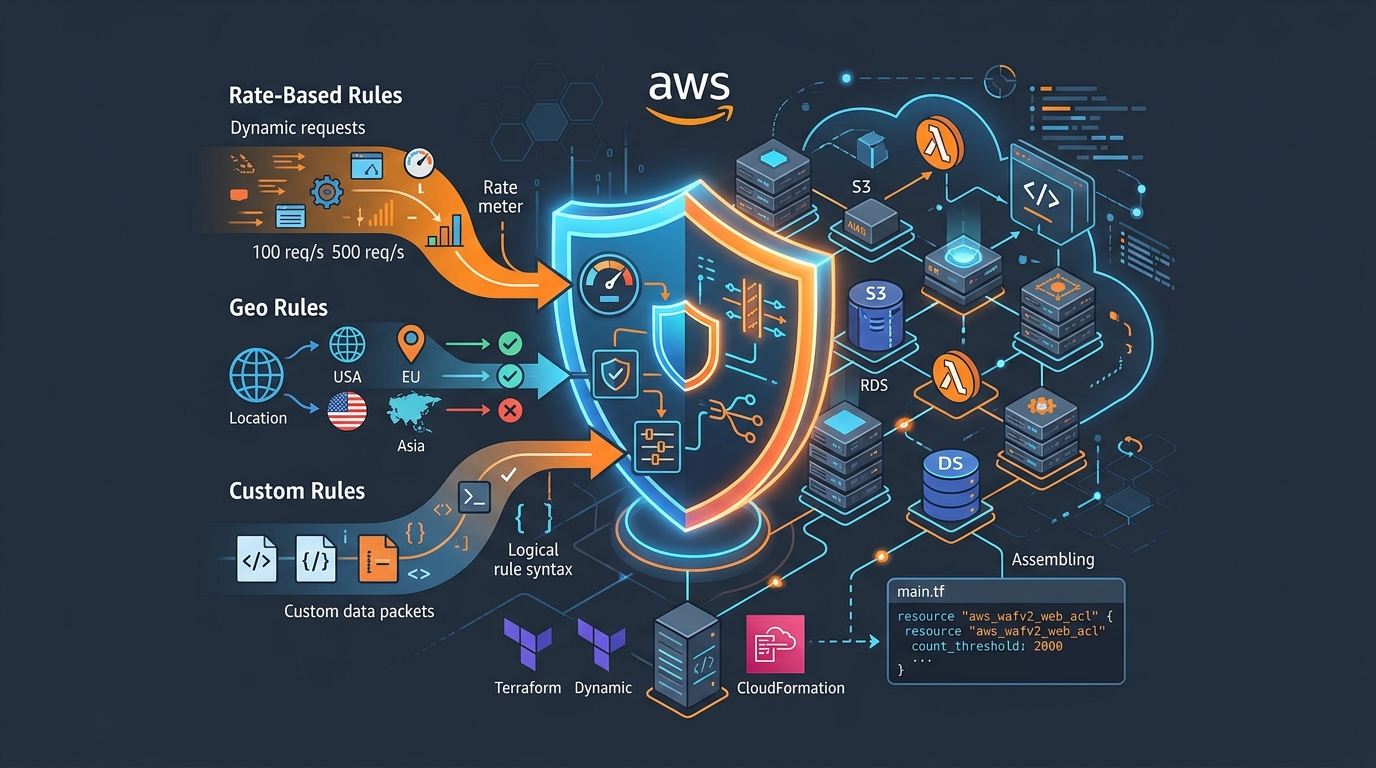
AWS WAF Rules Deep Dive: Rate-Based, Geo, and Custom Rules
WAF is one of those services where the default managed rules get you 80% of the way there. The last 20% is where it gets interesting.

Comments