OpenTelemetry + CloudWatch: Practical Observability for AWS in 2026

I used to instrument AWS services the hard way. AWS X-Ray SDK here, CloudWatch Logs there, custom metrics scattered across a dozen boto3 calls. Each service had its own observability story, and stitching them together during an incident felt like detective work. Then I started using OpenTelemetry with CloudWatch, and everything changed.
The promise is simple: one instrumentation library, one data format, multiple backends. But the real power comes when you pair it with AWS Distro for OpenTelemetry and CloudWatch Application Signals. I’ve instrumented dozens of services with this stack now, and it’s become my default choice for anything running on AWS.
Here’s what actually works in 2026.
What OpenTelemetry Actually Is
OpenTelemetry is not a backend. It’s not a monitoring service. It’s an open standard for collecting telemetry data—traces, metrics, and logs—from your application code.
Think of it this way: your application is a factory. Observability is watching that factory. OpenTelemetry is the equipment that measures everything: cameras (traces), flow meters (metrics), logbooks (logs). CloudWatch is the control room where you watch all those measurements.
OTel sits in your application code and collects signals. It doesn’t store anything. It doesn’t make decisions. It just exports data to wherever you tell it to—CloudWatch, Datadog, New Relic, Grafana, or all of them at once. That’s the magic. You instrument once, export anywhere.
OTel covers three signal types. Traces track a request as it moves through your system — a tree of spans, each representing a unit of work. A request hitting your API gateway, then a Lambda, then DynamoDB becomes one trace with three connected spans. When latency spikes, traces show you exactly where time went.
Metrics are the numbers: request count, error rate, database connection pool size. OTel standardizes how these get recorded and exported so every backend reads them the same way.
Logs are text events from your application code. The part that changes everything is automatic trace context injection — every log line automatically gets tagged with the trace ID of the request that produced it. When you find a slow trace, you can immediately pull every log from that request. No more guessing which log belongs to which invocation.
Why OpenTelemetry Over AWS X-Ray SDK
You could instrument AWS services directly with the X-Ray SDK. It works. But it locks you to AWS.
If your company decides to evaluate Datadog, you’re rewriting instrumentation. If you migrate a service to Google Cloud, you need new code. If you want to send metrics to Prometheus while keeping traces in CloudWatch, you write custom exporters. None of this is impossible, but it’s friction.
OTel removes that friction. The instrumentation is vendor-agnostic. Your FastAPI app doesn’t know whether traces go to CloudWatch, Datadog, or Grafana—that’s a configuration decision, not a code decision.
I’ve moved services from CloudWatch to Datadog and back. With OTel, it was a config file change. With X-Ray SDK, it was code refactoring.
There’s another reason: OTel auto-instrumentation is mature now. You can instrument a FastAPI app with a single pip install and an environment variable. The X-Ray SDK requires manual span creation for most operations. OTel handles it automatically through bytecode patching.
And the community is bigger. Most libraries—Django, FastAPI, sqlalchemy, requests, boto3—have OTel integrations. The X-Ray SDK covers the essentials, but OTel integration is often deeper and more consistent.
The OpenTelemetry Collector: Your Data Pipeline
OTel client libraries in your application export data, but they don’t export it directly to CloudWatch. They send it to the OpenTelemetry Collector.
The collector is a separate service that receives telemetry data, processes it, and exports it to backends. You run it as a sidecar container in ECS, a DaemonSet in Kubernetes, or an agent on your machine. Data flows: application → collector → CloudWatch.
Why not send directly from the app? Because the collector decouples your app from the backend. If CloudWatch goes down, the collector buffers data and retries. If you need to enrich traces with environment variables or filter sensitive data, the collector does that. If you decide tomorrow to export to two backends, the app doesn’t change.
AWS maintains AWS Distro for OpenTelemetry (ADOT), a distribution of the collector optimized for AWS workloads. It comes pre-configured with CloudWatch exporters, X-Ray support, and AWS-specific processors. If you’re running on AWS, ADOT is the right choice. It’s actively maintained, supports all major platforms (ECS, EKS, EC2), and handles AWS authentication automatically.
The collector has a three-part config:
Receivers listen for data. The OTLP receiver listens on localhost:4317 for data from your app.
Processors transform data. The batch processor groups telemetry into batches before export, which reduces API calls and costs. The memory limiter processor caps memory usage. Custom processors can add resource attributes or drop sensitive fields.
Exporters are the last step — they push data to the actual backend. The CloudWatch exporter handles traces and metrics. The X-Ray exporter handles traces for X-Ray’s service map. You can wire multiple exporters into the same pipeline, which is how you send to CloudWatch and another backend at the same time without touching your app code.
Traces: Wiring Requests Across Services
A trace tracks a single request through your system. In a monolith, it’s a straight line: HTTP request → business logic → database. In a microservice architecture, it’s a tree: API Gateway → Service A → Service B → DynamoDB.
OTel auto-instrumentation handles most of this for you. When you instrument FastAPI with OTel, every incoming HTTP request automatically creates a root span. When that request calls another service via boto3 or requests, OTel automatically creates a child span and propagates the trace ID in the HTTP headers.
Trace context propagation is critical. Standards like W3C Trace Context define headers that carry trace ID and parent span ID between services. Lambda to Lambda, ECS to ECS, even across different clouds—if both sides implement the standard, context flows.
Manual spans are sometimes necessary. When you’re doing custom business logic that doesn’t have an OTel integration, you create a span manually:
from opentelemetry import trace

tracer = trace.get_tracer(__name__)

def process_payment(payment_id):
    with tracer.start_as_current_span("process_payment") as span:
        span.set_attribute("payment.id", payment_id)
        # your logic here
But I try to avoid it. Auto-instrumentation is better—less code, fewer bugs, consistent naming.
Lambda has a quirk: every invocation is a separate execution context, so the trace automatically starts fresh. But if you have a Lambda that calls another Lambda, the caller propagates context in the event payload, and the receiver extracts it. ADOT handles this with the Lambda instrumentation.
Metrics: Custom Signals Without Explosion
Metrics are the most misunderstood signal. People think “I’ll send every gauge and counter to CloudWatch” and then get shocked at the bill. CloudWatch charges $0.30 per metric per month. If you have 1,000 services, each sending 50 metrics, that’s $150,000 per month just for metrics storage.
OTel metrics are different from CloudWatch custom metrics API. With OTel, you define a meter and create instruments:
from opentelemetry import metrics

meter = metrics.get_meter(__name__)

request_counter = meter.create_counter(
    "http.requests",
    unit="1",
    description="Count of HTTP requests"
)

latency_histogram = meter.create_histogram(
    "http.request.duration_ms",
    unit="ms",
    description="HTTP request duration"
)

# In your request handler:
request_counter.add(1, {"method": "GET", "endpoint": "/api/users"})
latency_histogram.record(145, {"method": "GET", "endpoint": "/api/users"})
The collector receives these instruments and decides what to export. You can aggregate by time window, drop attributes to reduce cardinality, or sample sparingly. The CloudWatch exporter then converts these to CloudWatch metrics.
Here’s the trick: OTel instruments auto-generate metrics from traces. The FastAPI instrumentation automatically creates metrics for request count and latency, broken down by method, endpoint, and status code. You get that for free without writing a single metric line.
Custom metrics matter for domain logic: purchase count, inventory level, queue depth. But don’t emit a metric for every database connection or every cache hit. Use traces and logs for detailed debugging. Use metrics for the numbers that actually matter to business or operations.
Logs: Correlation by Trace ID
OTel’s log correlation feature is underrated. When you log from within a request, OTel automatically injects the trace ID into the log record. When that log gets exported to CloudWatch Logs, it carries the trace ID.
Now you can search CloudWatch Logs for a specific trace ID and see every log line from that request. It’s the difference between “find the error that happened at 2:15 PM” and “find the error that happened in this specific request.”
Setup is minimal. With OTel’s log instrumentation:
import logging
from opentelemetry.instrumentation.logging import LoggingInstrumentor

LoggingInstrumentor().instrument()

logger = logging.getLogger(__name__)
logger.info("Processing payment")  # Trace ID automatically added
The ADOT collector receives logs and can enrich them with resource attributes—service name, environment, instance ID. The CloudWatch Logs exporter sends them to CloudWatch Logs with the trace ID preserved.
In CloudWatch Logs Insights, correlating logs to a trace is simple:
fields @timestamp, @message, trace_id
| filter trace_id = "4bf92f3577b34da6a3ce929d0e0e4736"
Or if you’re looking at a specific trace in the CloudWatch console, you can click a link to jump to all related logs.
Practical Setup: ECS Fargate + FastAPI + ADOT
Let me walk through a real setup. We have a Python FastAPI app running on ECS Fargate. We want traces, metrics, and logs in CloudWatch.
First, the FastAPI app needs OTel instrumentation:
pip install opentelemetry-api \
  opentelemetry-sdk \
  opentelemetry-instrumentation-fastapi \
  opentelemetry-instrumentation-sqlalchemy \
  opentelemetry-exporter-otlp \
  opentelemetry-distro
Then, in your app startup:
from fastapi import FastAPI
from opentelemetry.sdk.trace import TracerProvider
from opentelemetry.sdk.trace.export import BatchSpanProcessor
from opentelemetry.exporter.otlp.proto.grpc.trace_exporter import OTLPSpanExporter
from opentelemetry.instrumentation.fastapi import FastAPIInstrumentor
from opentelemetry.instrumentation.sqlalchemy import SQLAlchemyInstrumentor
from opentelemetry import trace
import logging

app = FastAPI()

# Setup tracing
otlp_exporter = OTLPSpanExporter(
    endpoint="http://localhost:4317"  # ADOT collector address
)
trace.set_tracer_provider(TracerProvider())
trace.get_tracer_provider().add_span_processor(
    BatchSpanProcessor(otlp_exporter)
)

# Auto-instrument
FastAPIInstrumentor.instrument_app(app)
SQLAlchemyInstrumentor().instrument()

# Setup logging with trace context
logging.basicConfig(
    format="%(asctime)s - %(name)s - %(levelname)s - %(message)s"
)

@app.get("/api/users/{user_id}")
async def get_user(user_id: int):
    return {"id": user_id, "name": "John"}
The app is instrumented. Every request creates spans, logs get trace IDs, and database calls are measured. Data goes to localhost:4317, which is where the ADOT collector listens.
Now the ECS task definition. The app container sends data to the ADOT collector sidecar:
{
  "family": "my-api-task",
  "networkMode": "awsvpc",
  "requiresCompatibilities": ["FARGATE"],
  "cpu": "512",
  "memory": "1024",
  "containerDefinitions": [
    {
      "name": "app",
      "image": "my-account.dkr.ecr.us-east-1.amazonaws.com/my-api:latest",
      "essential": true,
      "portMappings": [{"containerPort": 8000}],
      "environment": [
        {
          "name": "OTEL_EXPORTER_OTLP_ENDPOINT",
          "value": "http://localhost:4317"
        },
        {
          "name": "OTEL_SERVICE_NAME",
          "value": "my-api"
        },
        {
          "name": "OTEL_RESOURCE_ATTRIBUTES",
          "value": "environment=production"
        }
      ]
    },
    {
      "name": "adot-collector",
      "image": "public.ecr.aws/aws-observability/aws-for-fluent-bit:latest",
      "essential": true,
      "portMappings": [{"containerPort": 4317, "protocol": "tcp"}],
      "logConfiguration": {
        "logDriver": "awslogs",
        "options": {
          "awslogs-group": "/ecs/my-api-collector",
          "awslogs-region": "us-east-1",
          "awslogs-stream-prefix": "ecs"
        }
      },
      "environment": [
        {
          "name": "AWS_REGION",
          "value": "us-east-1"
        }
      ],
      "mountPoints": [
        {
          "sourceVolume": "otel_config",
          "containerPath": "/etc/otel"
        }
      ]
    }
  ],
  "volumes": [
    {
      "name": "otel_config",
      "host": {}
    }
  ]
}
The ADOT collector config lives in a file that you mount into the container. Here’s a typical config.yaml:
receivers:
  otlp:
    protocols:
      grpc:
        endpoint: 0.0.0.0:4317

processors:
  batch:
    send_batch_size: 100
    timeout: 10s

  memory_limiter:
    check_interval: 5s
    limit_mib: 512

  attributes:
    actions:
      - key: environment
        value: production
        action: upsert

exporters:
  logging:
    loglevel: debug

  awscloudwatch:
    log_group_name: /aws/ecs/my-api
    log_stream_name: otel
    region: us-east-1

  awsxray:
    region: us-east-1

service:
  pipelines:
    traces:
      receivers: [otlp]
      processors: [memory_limiter, batch, attributes]
      exporters: [awsxray, logging]

    metrics:
      receivers: [otlp]
      processors: [memory_limiter, batch]
      exporters: [awscloudwatch]

    logs:
      receivers: [otlp]
      processors: [memory_limiter, batch]
      exporters: [awscloudwatch]
The ADOT collector receives data on port 4317, processes it (batching, adding attributes), and exports to CloudWatch and X-Ray.
CloudWatch Application Signals: The New Era
As of 2026, CloudWatch Application Signals is the AWS answer to “how do I visualize observability data?” It consumes OTel traces and metrics and renders service maps, SLOs, and anomaly detection.
Application Signals shows your services as boxes, with lines representing calls between them. When latency spikes in one service, you see it highlighted. When an error rate jumps, the dashboard shows which service and which operation.
It works because OTel data is standardized. The traces include service names, operation names, and status codes. Application Signals understands this format natively, so no custom configuration needed.
Setting SLOs with Application Signals
An SLO (Service Level Objective) is a target for availability and performance. CloudWatch Application Signals lets you define SLOs directly from your metrics.
Say your API should respond in under 500ms for 99% of requests. You’d set an SLO like this with AWS CLI:
aws cloudwatch put-metric-alarms \
  --alarm-name "my-api-latency-slo" \
  --alarm-description "API p99 latency under 500ms" \
  --metric-name Duration \
  --namespace AWS/ApplicationSignals \
  --statistic p99 \
  --period 300 \
  --threshold 500 \
  --comparison-operator LessThanOrEqualToThreshold \
  --dimensions Name=Service,Value=my-api Name=Operation,Value=GET/api/users \
  --evaluation-periods 1
Application Signals consumes this SLO and tracks compliance. If you hit 99% of requests under 500ms, the SLO is met. If you miss the target even once, it gets recorded. Over a month, your SLO compliance tells you whether you’re meeting user expectations.
You’d typically set two SLOs per service: one for availability (error rate under 0.1%) and one for latency (p99 under your target). Together, they define your service’s reliability contract.
The Three Signals Tell a Story
Let me give you the real debugging moment that made me believe in this stack.
Last month, our API started timing out. Not consistently—just every few minutes, one in a thousand requests would hit 5 seconds instead of 200ms. The frontend was retrying, so users didn’t notice much, but the error rate in Application Signals jumped.
I opened the service map. My-api looked normal—p99 latency was 800ms. But the box for my-database service showed its p99 at 4 seconds. So the database was slow.
But why? I clicked into the metrics. The metrics showed CPU was fine, memory was fine, connection pool wasn’t maxed. So it wasn’t a resource problem.
I pulled a trace from one of the slow requests. Three database queries: user fetch (100ms), permissions fetch (150ms), settings fetch (4 seconds). The settings query was the culprit — taking 40x longer than the others.
I jumped to the logs for that trace. A single log line:
SELECT * FROM settings WHERE user_id = 123 -- took 4000ms
That query didn’t have an index on user_id. I checked git history. Two days ago, someone added a settings table and didn’t index the user lookup. With 10,000 users, the table scan was killing latency.
Added the index, deployed, latency dropped. The whole debugging session took ten minutes because the three signals—metrics showing the slow service, traces showing the slow query, logs showing the missing index—told the story in sequence.
Without OTel, I would have been guessing. X-Ray alone doesn’t show metrics. CloudWatch Logs alone doesn’t show where time is spent. CloudWatch Metrics alone doesn’t show which query was slow. Together, they’re perfect.
Cost: Metrics Pricing and Avoiding Explosion
CloudWatch charges $0.30 per metric per month, with a minimum of $0.01 per metric if you send less than one month’s worth of data. Traces in X-Ray cost $5.00 per million ingested. Logs cost based on ingestion and retention.
For a service sending OTel data:
- Auto-instrumented FastAPI service sends about 10 metrics (request count by endpoint, latency histogram by endpoint, etc.). That’s $3 per month.
- Every request creates one trace. 1 million requests per month costs $5.
- Logs depend on how verbose your code is, typically $1-10 per month per service.
A typical service: $10-20 per month. Reasonable.
The risk is cardinality explosion. If you emit a metric for every user ID, or every product SKU, you get one metric per value. CloudWatch still charges $0.30 per metric, so a service with 1 million user IDs sending a metric per user would cost $300,000 per month. That’s not OTel’s fault—that’s you instrumenting wrong.
The fix is discipline about what you emit. User-specific metrics are the most common mistake — instead of a metric per user ID, emit a histogram of latency across all users. One metric, not a million.
The same logic applies to low-cardinality events. A “button clicked” metric with 500 combinations of page, button, user, and context will destroy your bill. Stick to signals that operations teams actually query.
Use the ADOT collector to drop attributes before export. Anything you don’t need to query in CloudWatch should be stripped at the collector level. And for high-volume services — millions of requests per second — sample your traces. Sampling at 10% still gives you statistically meaningful data and cuts X-Ray costs proportionally.
When OTel Is Not Worth It
For a small, simple service, OTel might be overkill. If you have a single Lambda function that calls one API and stores data in one table, native CloudWatch is fine. Add CloudWatch Logs and a basic alarm, and you’re done.
OTel shines when you have multiple services, complex call chains, or performance problems that need detailed debugging. If you’re a one-engineer startup, shipping fast matters more than perfect observability. Ship with CloudWatch Logs and Metrics, and add OTel when you need it.
Multi-service architectures almost always benefit. If you have three services talking to each other, the trace correlation alone is worth it. If you’re running microservices on EKS, OTel is essential.
The right time to add OTel is when you hit the limits of the native tools. When you’re looking at three dashboards to debug a single request, that’s your signal.
Wrapping Up
OpenTelemetry is boring in the best way. It doesn’t claim to be a backend. It doesn’t try to be fancy. It’s a standard that works everywhere, pairs well with CloudWatch, and gives you the visibility you need to debug production.
ADOT makes it easy on AWS. CloudWatch Application Signals makes visualization intuitive. Together, they’re a complete observability stack for modern AWS applications.
The story I told—latency spike, service map, trace, log, root cause—is exactly what this stack delivers. Add OTel to your next service. The setup cost is minimal, the debugging benefit is real.
Related Posts
If you’re running agents or orchestrating complex workflows, also check out observability for Bedrock agents and AgentCore — they also export OTel traces and integrate with CloudWatch Application Signals.
For tracing across Step Functions and EventBridge workflows, see our guide on EventBridge and Step Functions patterns.
Explore more like this
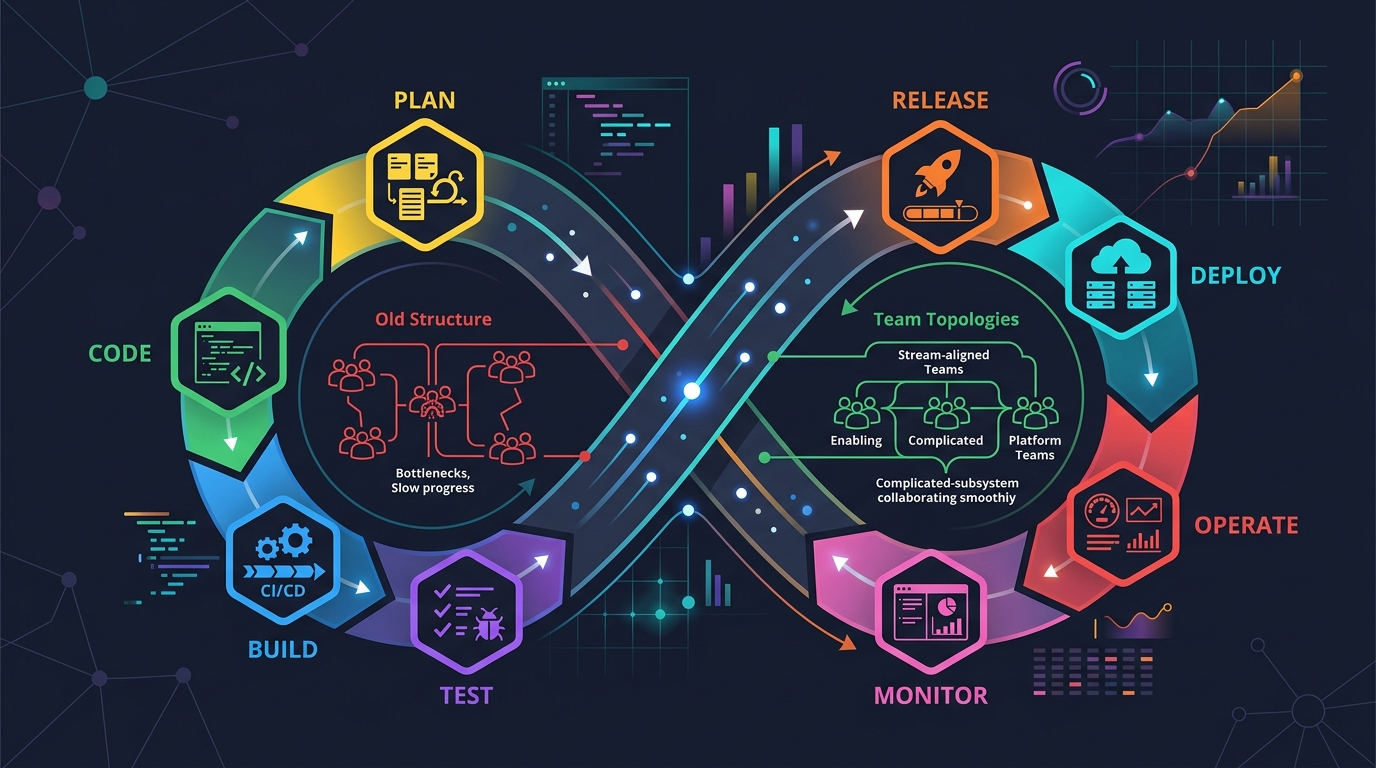
Scrum + Team Topologies: Why Your DevOps Team Structure Might Be Slowing You Down
I spent three years at a company that spent $4 million on “DevOps transformation.” New tools, new cloud infrastructure, training budgets, the works. The velocity of the platform stayed flat....
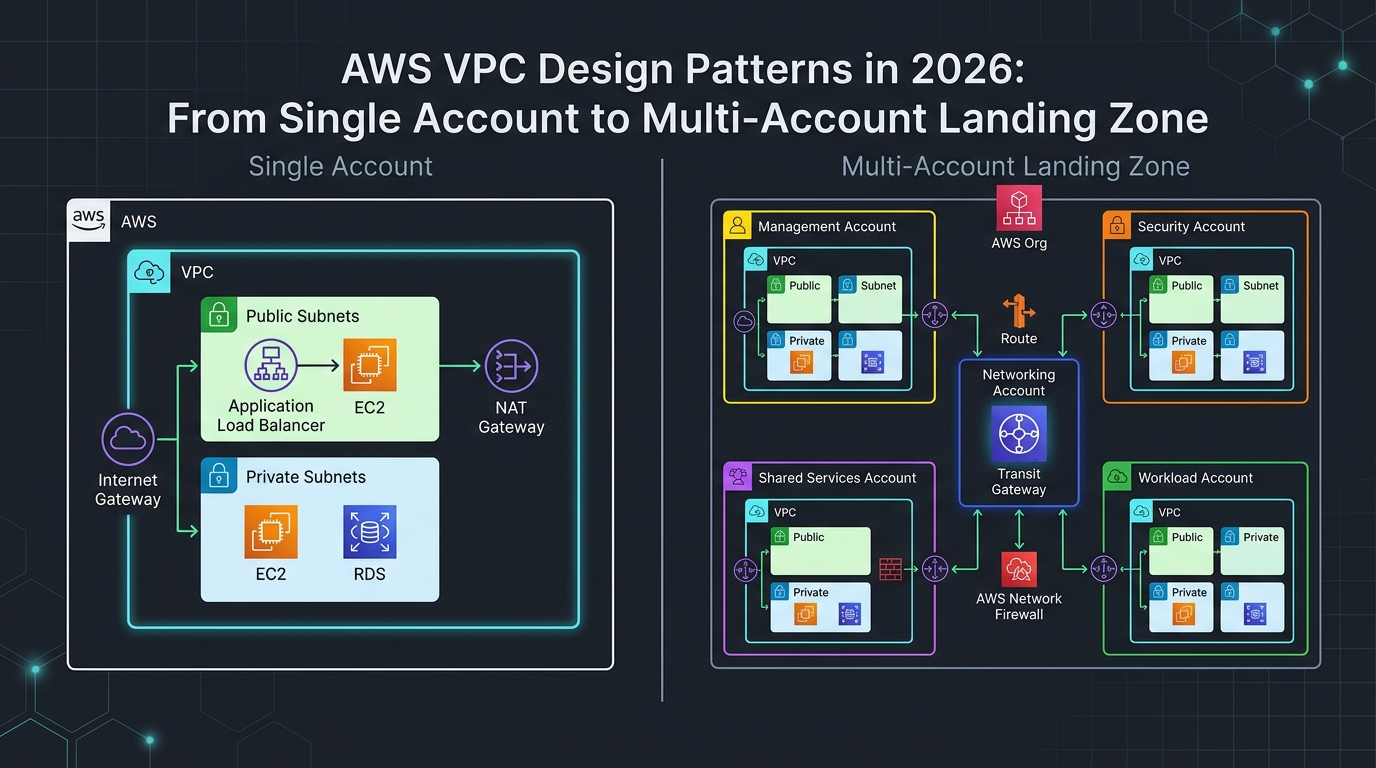
AWS VPC Design Patterns in 2026: From Single Account to Multi-Account Landing Zone
The VPC decisions you make on day one will follow you for years. I’ve lived through the consequences—redesigning a network that was built without proper CIDR planning, watching a simple...

Comments