SQS + Lambda Event Source Mapping: Error Handling That Actually Works
Every serverless architecture eventually runs into the same problem: you have messages in SQS and you need Lambda to process them reliably. Not just the happy path — reliably. Meaning when a message fails, you don’t lose it. When a batch partially fails, you don’t reprocess the messages that already worked. When Lambda times out, you don’t end up in an infinite loop of duplicate invocations.
I’ve set up SQS-to-Lambda integrations more times than I can count. The first few times I did it wrong. This post is everything I wish I’d known up front.
How Event Source Mapping Actually Works
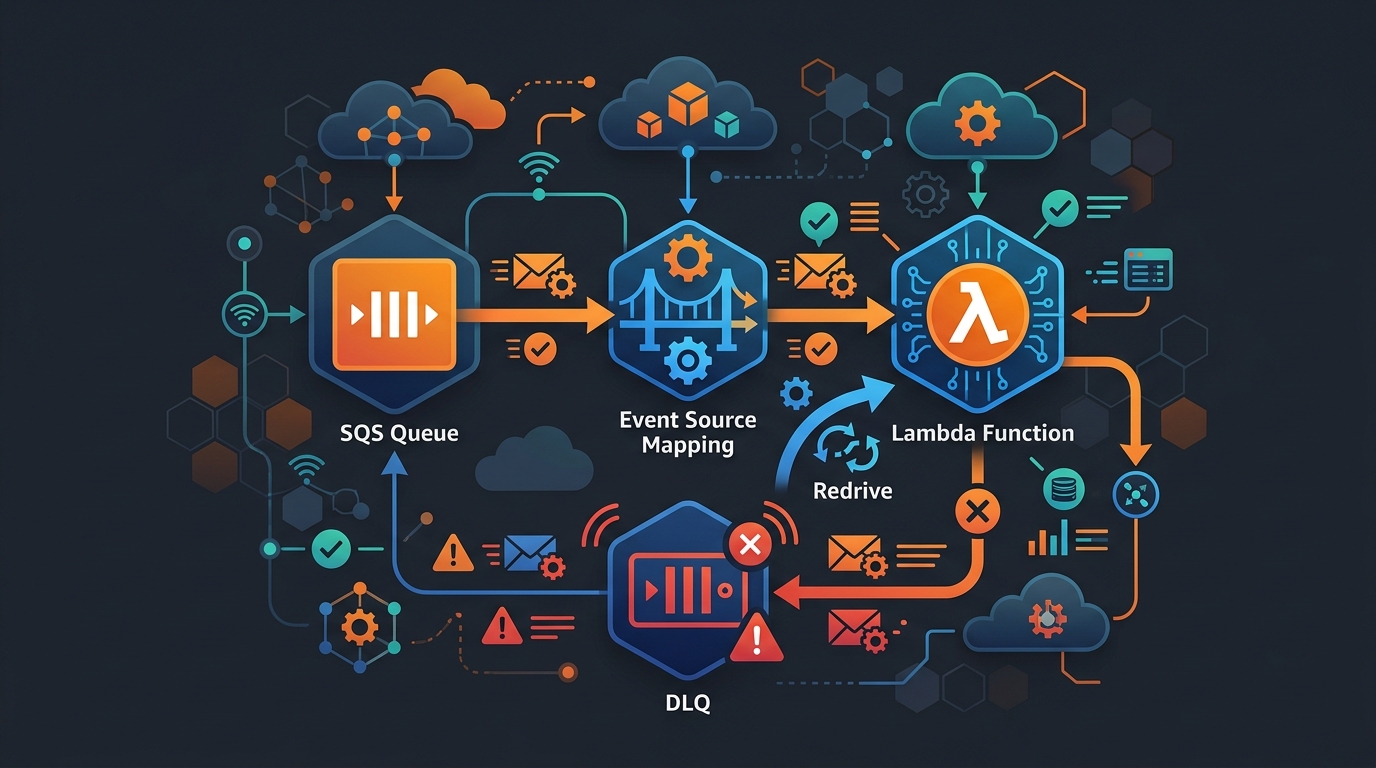
Lambda’s event source mapping is a polling mechanism managed by AWS, not by your code. The Lambda service itself continuously long-polls your SQS queue and invokes your function when messages are available. You don’t write the polling loop — you just configure the mapping and write the handler.
A few things worth understanding about the mechanics:
Polling is concurrent, not serial. Lambda can run multiple pollers against the same queue simultaneously. With standard queues, it scales up to 1,000 concurrent Lambda executions. With FIFO queues it’s capped at the number of active message groups.
Messages are leased, not consumed. When Lambda picks up a batch, SQS sets those messages invisible for the duration of the visibility timeout. If Lambda processes the batch successfully, SQS deletes the messages automatically. If Lambda errors out or times out, the messages become visible again and another invocation picks them up.
Batches are all-or-nothing by default. If one message in a batch of ten fails, all ten go back to the queue — even the nine that succeeded. This is the source of enormous pain and wasted compute. I’ll get to the fix in a moment.
Failed batches count toward maxReceiveCount. Every time a message is returned to the queue because Lambda errored, its receive count increments. Once it hits the queue’s maxReceiveCount, SQS moves it to the dead-letter queue. This is your safety net.
Batch Size: 1 vs 10 vs 10,000
The batch size setting is one of the most consequential decisions you’ll make, and the right answer depends on what your Lambda actually does.
Batch size 1 means one message per Lambda invocation. This is the safest choice and the most expensive. Every message is isolated — a failure only affects that one item. You pay per invocation, and with high-throughput queues you’ll hit Lambda concurrency limits fast. Use batch size 1 when each message is expensive to reprocess, when your Lambda does complex work with side effects, or when you’re first building something and want the simplest error model.
Batch size 10 is the default and a reasonable middle ground for most workloads. Failures affect a batch, not just one message, so you need proper error handling. But you get 10x the throughput per concurrent invocation compared to batch size 1.
Batch size 10,000 is for high-throughput data pipeline work — think log ingestion, event aggregation, analytics. You get massive throughput reduction and cost savings, but error handling becomes critical. With 10,000 messages in a batch, a single bad message failing the entire batch and sending 9,999 good messages back to be reprocessed is a real disaster. You absolutely must use ReportBatchItemFailures at this scale.
One more setting that matters here: batch window. This tells Lambda to wait up to N seconds to fill a batch before invoking your function. If you set a batch size of 100 and your queue only gets 20 messages per second, without a batch window Lambda fires immediately at 20 messages. With a 5-second batch window it waits, accumulates more messages, and invokes less often. This reduces cold starts and cost at the expense of latency.
ReportBatchItemFailures: The Game Changer
Before AWS added ReportBatchItemFailures, partial batch failure handling was a mess. You’d either fail the whole batch, or you’d catch exceptions per message and silently swallow failures (terrible), or you’d manually delete successful messages from SQS inside your Lambda handler using the boto3 SQS client (fragile and requires extra IAM permissions).
ReportBatchItemFailures changes the contract. Instead of signaling success or failure for the whole batch, your Lambda returns a structured response telling SQS exactly which message IDs failed. SQS deletes the successes and puts only the failures back on the queue.
Here’s a Python handler that does this properly:
import json
import logging

logger = logging.getLogger()
logger.setLevel(logging.INFO)


def handler(event, context):
    failed_message_ids = []

    for record in event["Records"]:
        message_id = record["messageId"]
        try:
            process_message(record)
            logger.info("Processed message %s", message_id)
        except Exception as e:
            logger.error("Failed to process message %s: %s", message_id, str(e))
            failed_message_ids.append({"itemIdentifier": message_id})

    return {"batchItemFailures": failed_message_ids}


def process_message(record):
    body = json.loads(record["body"])
    # Your actual processing logic here
    # Raise an exception to signal failure for this message
    if not body.get("required_field"):
        raise ValueError(f"Missing required_field in message: {body}")
    # ... do work
Two things to notice. First, the function never raises an unhandled exception — catching per message and collecting failures is the entire pattern. Second, the return value is always a dict with batchItemFailures. An empty list means all succeeded. A populated list means some failed and SQS should retry only those.
To enable this, you set FunctionResponseTypes: [ReportBatchItemFailures] on the event source mapping. Without that setting, Lambda ignores the batchItemFailures key in your response entirely.
One important edge case: if your Lambda handler itself crashes with an uncaught exception (not a per-message error, but something at the handler level), the entire batch is retried. That’s correct behavior — it means something went wrong before you could even process individual messages.
DLQ Configuration: Queue vs Lambda
There are two places you can attach a dead-letter queue: on the SQS queue itself, or on the Lambda function. They handle different failure scenarios and you should understand the distinction.
DLQ on the SQS queue catches messages that exceed maxReceiveCount. This is what protects you from poison pill messages — messages that consistently cause Lambda to fail and would otherwise loop forever. After maxReceiveCount retries, SQS moves the message to the DLQ automatically. This is the primary DLQ you should always configure.
DLQ on the Lambda function catches asynchronous invocation failures — but event source mapping invocations are synchronous from Lambda’s perspective. If you’re using an event source mapping (which you are with SQS), the Lambda DLQ does not apply. It only applies to invocations that come from S3, SNS, EventBridge, and other asynchronous event sources. I’ve seen teams configure a Lambda DLQ thinking it covers SQS failures and then wonder why messages are disappearing. They’re not going to the Lambda DLQ — they’re going back to the SQS queue or to the SQS DLQ.
The right setup: configure the DLQ on the SQS queue. Set maxReceiveCount to something reasonable — I typically use 3 to 5, depending on whether transient failures are expected. If your downstream service occasionally blips, give it more retries. If failures are almost always bugs, keep it lower so poison pills hit the DLQ faster.
See SQS Dead Letter Queue for a full walkthrough of DLQ monitoring and redriving messages back to the source queue.
Backoff and Visibility Timeout Strategy
The default retry behavior with SQS + Lambda has no backoff. A message fails, it becomes visible again immediately (or after a short delay depending on your visibilityTimeout), and Lambda picks it up and tries again. If the failure is transient — a downstream service is down — you get a thundering herd of retries hammering the same unavailable service.
You have a few options here.
Increase the queue’s visibility timeout. This adds a delay between retries. If your Lambda takes 30 seconds to process a message, your visibility timeout should be at least 6x that — Lambda’s recommendation is 6x the function timeout. But this affects all retries equally, not just after failures.
Use ChangeMessageVisibility inside your handler. When you catch a per-message failure, you can call SQS to extend the visibility timeout for that specific message before returning it as a failure. This is a manual backoff implementation — first retry visible in 30 seconds, second in 5 minutes, third in 30 minutes. It requires the sqs:ChangeMessageVisibility IAM permission and the queue URL, but it works.
Use a FIFO queue with message deduplication. FIFO queues don’t support per-message backoff directly, but the message group structure gives you more control over retry ordering.
The critical constraint: your Lambda timeout must be less than the SQS visibility timeout. If Lambda takes longer to time out than SQS’s visibility timeout, SQS makes the message visible again while Lambda is still processing it. Another invocation picks it up. Now you have two Lambda instances processing the same message simultaneously. This is the source of the most confusing duplicate processing bugs I’ve seen.
Rule of thumb: visibilityTimeout >= 6 * lambdaTimeout. If your Lambda timeout is 60 seconds, set visibility timeout to at least 6 minutes.
FIFO Queues: MessageGroupId Implications
FIFO queues with Lambda work, but they have constraints you need to design around.
Lambda processes FIFO queues one message group at a time. Messages within a group are processed in order, and Lambda won’t process the next message in a group until the previous one completes. This is the guarantee you’re buying — ordered, exactly-once processing within a group.
The consequence: your throughput ceiling is the number of active message groups. With 10 message groups, you get at most 10 concurrent Lambda invocations processing that FIFO queue. With 1,000 groups, you can scale to 1,000 concurrent. If you’re using a single MessageGroupId for everything, you’ve made your FIFO queue effectively single-threaded with Lambda. That’s usually a mistake.
Design your MessageGroupId to reflect your actual ordering requirements. If you need ordered processing per user, use the user ID as the group ID. If you need ordered processing per transaction, use the transaction ID. If you don’t actually need ordering, use a standard queue — you’ll get better throughput and simpler error handling.
One more FIFO gotcha: ReportBatchItemFailures works differently with FIFO queues. When a message in a FIFO batch fails, all messages after it in the same message group are also considered failed and returned to the queue. Order must be preserved.
Terraform: Full Setup
Here’s a complete Terraform configuration for SQS + Lambda + DLQ with ReportBatchItemFailures:
resource "aws_sqs_queue" "main" {
  name                      = "my-service-queue"
  visibility_timeout_seconds = 360   # 6x the Lambda timeout of 60s
  message_retention_seconds  = 86400 # 1 day

  redrive_policy = jsonencode({
    deadLetterTargetArn = aws_sqs_queue.dlq.arn
    maxReceiveCount     = 4
  })
}

resource "aws_sqs_queue" "dlq" {
  name                      = "my-service-queue-dlq"
  message_retention_seconds = 1209600 # 14 days — give yourself time to investigate
}

resource "aws_lambda_function" "processor" {
  function_name = "my-service-processor"
  runtime       = "python3.12"
  handler       = "handler.handler"
  filename      = "function.zip"
  timeout       = 60
  role          = aws_iam_role.lambda_exec.arn

  environment {
    variables = {
      QUEUE_URL = aws_sqs_queue.main.url
    }
  }
}

resource "aws_lambda_event_source_mapping" "sqs_trigger" {
  event_source_arn                   = aws_sqs_queue.main.arn
  function_name                      = aws_lambda_function.processor.arn
  batch_size                         = 10
  maximum_batching_window_in_seconds = 5

  function_response_types = ["ReportBatchItemFailures"]

  scaling_config {
    maximum_concurrency = 100 # protect downstream services
  }
}

resource "aws_iam_role" "lambda_exec" {
  name = "my-service-lambda-exec"

  assume_role_policy = jsonencode({
    Version = "2012-10-17"
    Statement = [{
      Action    = "sts:AssumeRole"
      Effect    = "Allow"
      Principal = { Service = "lambda.amazonaws.com" }
    }]
  })
}

resource "aws_iam_role_policy_attachment" "lambda_basic" {
  role       = aws_iam_role.lambda_exec.name
  policy_arn = "arn:aws:iam::aws:policy/service-role/AWSLambdaBasicExecutionRole"
}

resource "aws_iam_role_policy" "sqs_access" {
  role = aws_iam_role.lambda_exec.id

  policy = jsonencode({
    Version = "2012-10-17"
    Statement = [{
      Effect = "Allow"
      Action = [
        "sqs:ReceiveMessage",
        "sqs:DeleteMessage",
        "sqs:GetQueueAttributes"
      ]
      Resource = aws_sqs_queue.main.arn
    }]
  })
}
Notice maximum_concurrency on the event source mapping. This is a relatively new feature that lets you cap how many concurrent Lambda invocations process the queue. Without it, Lambda will scale to 1,000 concurrent executions if the queue fills up. That’s often fine, but if your Lambda talks to RDS or another resource with a connection limit, you’ll overwhelm it. Set a realistic cap.
CloudWatch Metrics That Matter
Most teams set up a DLQ alarm and call it a day. These are the metrics I actually watch:
ApproximateAgeOfOldestMessage on the main queue. This tells you how far behind your Lambda processing is. If messages are sitting in the queue for minutes when they should be processed in seconds, you have a throughput problem — not enough concurrency, Lambda is throttling, or your function is slow. Set an alarm when this exceeds your latency SLO.
ApproximateNumberOfMessagesNotVisible on the main queue. These are messages currently being processed by Lambda. A spike here means Lambda picked up a lot of messages. A sustained high value that isn’t dropping means Lambda is processing slowly or failing and re-enqueuing.
NumberOfMessagesDeleted on the main queue. This is your throughput metric — messages successfully processed per time period. Graph it alongside your send rate to see if processing keeps up with ingestion.
ApproximateNumberOfMessagesVisible on the DLQ. Any message here needs investigation. Alarm on greater than zero and treat it as a priority. Messages in the DLQ mean your service is silently failing to process real events.
ConcurrentExecutions and Throttles on Lambda. Throttles mean Lambda wanted to scale but hit a limit — either the function’s reserved concurrency or the account-level limit. Throttled invocations cause SQS messages to become visible again and retry, which burns through maxReceiveCount without the failure being in your code.
For deeper observability patterns, see OpenTelemetry + CloudWatch: Practical Observability for AWS in 2026.
The Visibility Timeout Trap
I mentioned this earlier but it deserves its own section because I’ve seen it burn teams repeatedly.
The scenario: your Lambda timeout is set to 5 minutes (300 seconds). Your SQS visibility timeout is set to 30 seconds (the default). Lambda picks up a message. Processing takes 45 seconds — longer than the visibility timeout. At the 30-second mark, SQS makes the message visible again because it hasn’t been deleted. A second Lambda invocation starts processing the same message. Now you have two concurrent executions processing the same event.
For idempotent operations this is annoying but not catastrophic. For non-idempotent operations — sending an email, charging a credit card, writing a unique record — this is a serious bug.
The fix is simple: always set visibilityTimeout >= 6 * functionTimeout on your SQS queue. If your Lambda can run for 5 minutes, set visibility timeout to 30 minutes. It feels conservative but it’s the correct relationship.
And while you’re at it — set your Lambda timeout conservatively. A Lambda that can run for 15 minutes probably shouldn’t, and a 15-minute timeout with the 6x rule means 90-minute visibility timeout, which means failed messages sit invisible for 90 minutes before retrying. Keep timeouts tight, add proper monitoring, and fail fast.
Connecting the Pieces
SQS + Lambda event source mapping is one of the most reliable patterns in the AWS serverless toolkit once you understand the failure modes. The combination of ReportBatchItemFailures for partial batch handling, a properly configured DLQ on the SQS queue, a visibilityTimeout that actually exceeds your Lambda timeout, and maximum_concurrency to protect downstream services covers the majority of production issues.
The patterns here extend naturally to more complex orchestration. If you’re routing events to multiple processors based on message content, EventBridge + Step Functions covers the coordination layer. For Lambda performance work including layers and runtimes, see AWS Lambda Layers and Custom Runtimes. And if you’re thinking about how your SQS consumers scale with your infrastructure, Auto Scaling Lifecycle Hooks is worth reading for the EC2 side of the picture.
The dead letter queue is your last line of defense — configure it, alarm on it, and have a runbook for redriving messages when things go wrong. For a thorough guide on SQS Dead Letter Queue patterns including redrive policies and monitoring, that post covers everything you need.
Get the visibility timeout right, enable ReportBatchItemFailures, and watch ApproximateAgeOfOldestMessage. That’s 80% of operating SQS + Lambda reliably.
Related Posts: SQS Dead Letter Queue · EventBridge + Step Functions Patterns · AWS Lambda Layers and Custom Runtimes · High Availability on AWS
Explore more like this

Aurora Serverless v2 + Bedrock: AI Database Queries in 2026
I connected Bedrock to our Aurora cluster last month. The first thing I asked it was “show me all customers who churned in Q1 but came back in Q2” —...

Lambda Container Images: Build on GitLab CI, Deploy to ECR
Container images solved my biggest Lambda frustration: the 250MB zip limit.

Comments