AWS Cost Anomaly Detection: How to Stop Bill Surprises in 2026
I got a $5,200 AWS bill once. For a staging environment. On a project that was supposed to cost $800/month. The culprit? A developer ran a load test script against an RDS instance provisioned as a placeholder db.r6g.12xlarge — the kind of thing someone spins up “just to test quickly” and forgets about. That instance ran for eleven days straight before anyone noticed. By the time the monthly bill arrived, the damage was done.
That experience taught me something: AWS will happily let you spend money. There is no safety net unless you build one yourself. You can provision a $50/hour cluster with a single API call, and AWS won’t send you a confirmation email asking “are you sure?” That’s by design. Cloud agility means you move fast. But moving fast without cost monitoring is driving a sports car with no speedometer.
AWS Cost Anomaly Detection is the tool that would have caught my $5,200 mistake within hours instead of weeks. Combined with Budgets, Lambda automation, and proper tagging, you can build a cost monitoring pipeline that catches problems while they’re still cheap. This guide shows you how to set all of it up.
Why cost anomalies happen
Cost anomalies aren’t random. They follow predictable patterns. Understanding the patterns helps you catch them faster.
| Anomaly Pattern | What Happens | Typical Cost Impact | Root Cause |
|---|---|---|---|
| Forgotten test resource | EC2, RDS, or Redshift left running after testing | $200 - $5,000/month | No teardown process for ephemeral environments |
| NAT Gateway data spike | Unexpected traffic routed through NAT Gateway | $100 - $3,000/month | Misconfigured VPC routing or data scraping job |
| S3 versioning explosion | Delete markers and old versions accumulating | $50 - $2,000/month | Versioning enabled without lifecycle rules |
| Cross-region data transfer | Replication or backup traffic between regions | $200 - $4,000/month | Misconfigured replication or inter-region API calls |
| Auto-scaling runaway | Scaling group provisions instances beyond demand | $500 - $10,000/month | Broken CloudWatch alarm or wrong scaling metric |
| Lambda retry storm | Failed invocations triggering exponential retries | $50 - $1,500/month | Unhandled errors in downstream service |
| EBS snapshot backlog | Old snapshots never cleaned up | $100 - $800/month | No snapshot lifecycle policy |
| Bedrock model usage spike | AI/ML inference costs from unexpected query volume | $300 - $8,000/month | Public-facing chatbot without rate limiting |
Most of these share a common trait: they’re invisible. Your application runs fine. Your dashboards show green. But money is bleeding out through a resource nobody is watching.
Setting up AWS Cost Anomaly Detection
AWS Cost Anomaly Detection uses machine learning to establish a baseline of your normal spending patterns and alert you when something deviates. It’s free. There is no reason not to enable it.
Enable it from the Billing console or the CLI:
# Create a cost anomaly monitor for the entire account
aws ce create-anomaly-monitor \
  --monitor "{\"MonitorType\": \"DIMENSIONAL\", \"MonitorDimension\": \"LINKED_ACCOUNT\", \"MonitorName\": \"AccountSpendMonitor\"}"

# Create a monitor for a specific service (catches service-level spikes)
aws ce create-anomaly-monitor \
  --monitor "{\"MonitorType\": \"DIMENSIONAL\", \"MonitorDimension\": \"SERVICE\", \"MonitorName\": \"ServiceSpendMonitor\"}"
Once created, the monitor starts building a baseline. It needs about two weeks of historical data before it becomes accurate. During that window, you’ll see alerts that are either false positives or genuine anomalies the system is still calibrating for. Don’t ignore them — treat them as learning opportunities to calibrate your own intuition about what “normal” looks like for your account.
Setting up anomaly alerts
Monitors are useless without subscriptions. You need to tell AWS where to send the alerts:
# Create an SNS alert subscription
aws ce create-anomaly-subscription \
  --subscription "{\"SubscriptionName\": \"CostAnomalyAlerts\", \"Threshold\": 100, \"Frequency\": \"DAILY\", \"MonitorArn\": \"arn:aws:ce::123456789012:anomalymonitor/abc123\", \"Subscribers\": [{\"Type\": \"SNS\", \"Address\": \"arn:aws:sns:us-east-1:123456789012:cost-anomaly-alerts\"}]}"
The Threshold parameter sets the minimum dollar amount for an alert. I set mine to $100. That’s high enough to filter out noise but low enough to catch problems before they become expensive. For production accounts running large workloads, you might set it higher. For development accounts, $25 or even $10 catches the small leaks that add up over time.
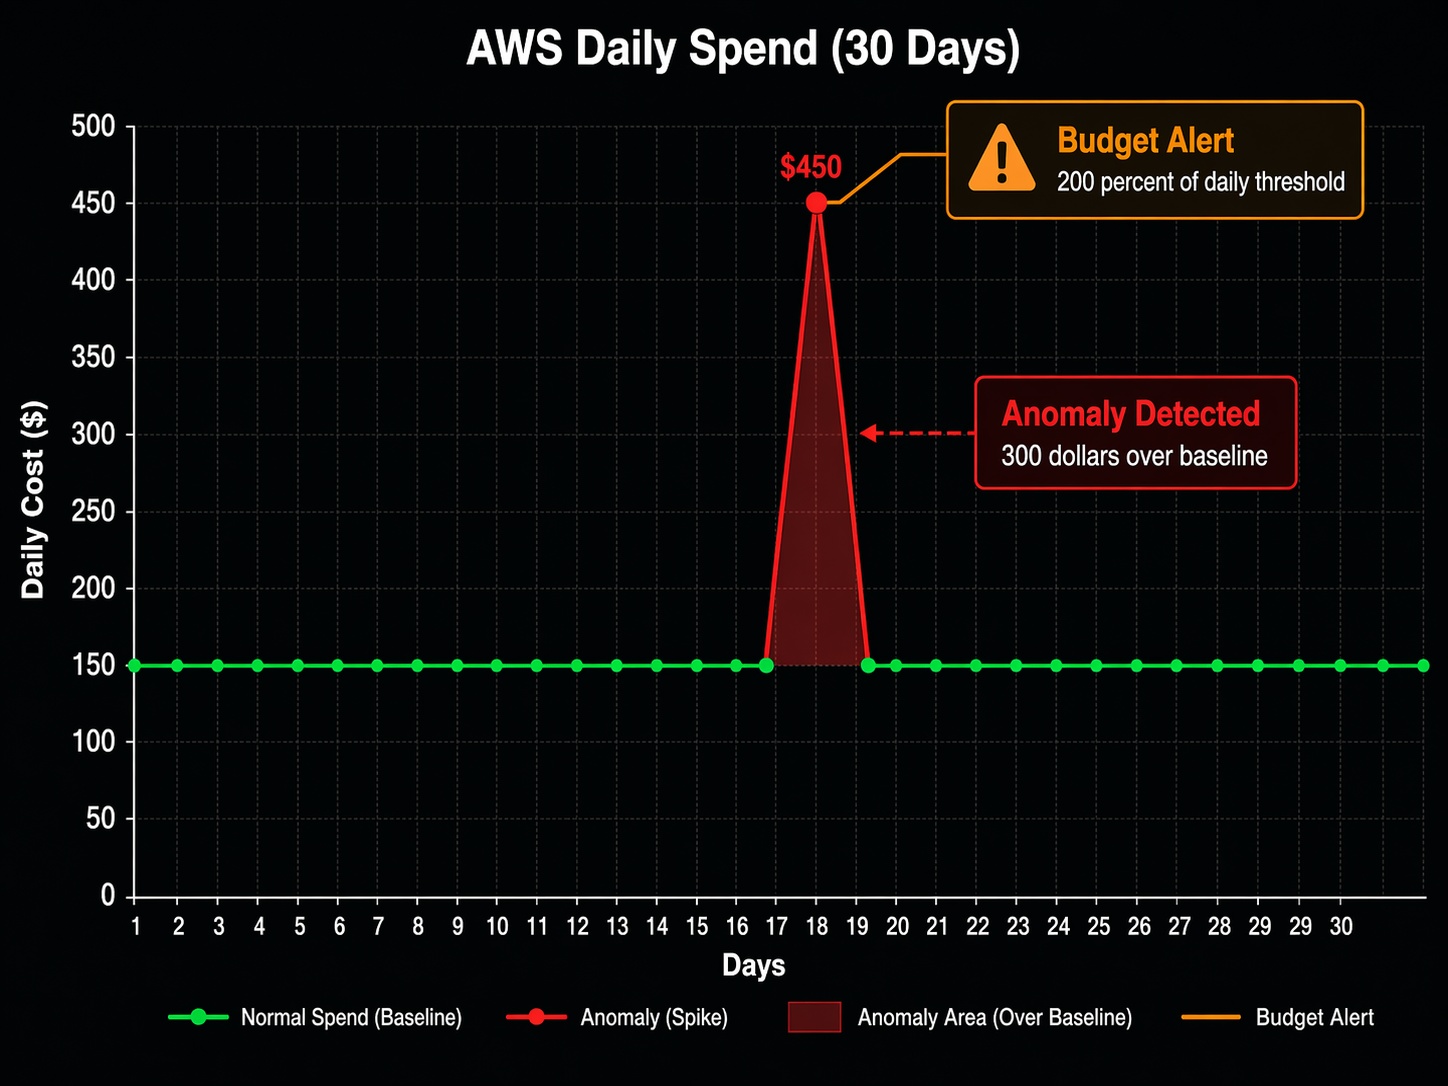
The alert includes the service, the expected spend, the actual spend, and the total impact. Here’s what a real anomaly alert looks like:
Anomaly detected in AWS account 123456789012

Service: Amazon Relational Database Service (RDS)
Region: us-east-1
Expected daily spend: $42.50
Actual daily spend: $187.30
Impact: $144.80 (340% increase)

Root cause: New DB instance db.r6g.12xlarge started on 2026-04-15
That’s the alert I wish I had gotten eleven days earlier. It would have saved me $4,700.
AWS cost monitoring tools comparison
AWS offers several cost monitoring tools, and they serve different purposes. Anomaly Detection catches unexpected spikes. Budgets enforces spending limits. Cost Explorer shows historical trends. Third-party tools add cross-cloud visibility and collaborative features.
| Feature | Cost Explorer | Budgets | Anomaly Detection | Third-Party (CloudHealth, Kubecost) |
|---|---|---|---|---|
| Primary purpose | Historical analysis | Spend thresholds | ML-based spike detection | Cross-cloud FinOps platform |
| Alert type | None (manual review) | Threshold-based | Pattern deviation | Policy-based + ML |
| Pricing | $0.01/API call, free console | First 62 budgets free, $0.01/day each after | Free | $2,000-$15,000+/month depending on spend |
| Detection speed | Retrospective only | Hours to days | Hours | Minutes to hours |
| Granularity | Daily, monthly | Daily, monthly, quarterly | Daily | Real-time to daily |
| Automation | None | Lambda, SNS | SNS | Webhooks, Slack, PagerDuty |
| Cross-account | Yes (Organizations) | Yes (Organizations) | Yes (Organizations) | Yes (multi-cloud) |
| Tag-based filtering | Yes | Yes | No (account/service level) | Yes |
| Best for | Understanding where money went | Enforcing spending limits | Catching surprises early | Enterprise FinOps programs |
The right approach uses all three AWS-native tools together. Cost Explorer answers “where did the money go?” Budgets answer “are we on track?” Anomaly Detection answers “is something wrong right now?” You can read more about how Cost Explorer and Budgets work together in the cost management guide I wrote earlier.
Third-party tools make sense when you’re running multi-cloud environments or need features AWS doesn’t provide natively: unit cost mapping (cost per customer, cost per feature), anomaly detection with custom dimensions, or collaborative budgeting across business units. For single-account AWS setups, the native tools are sufficient.
Building an automated cost alert pipeline with Lambda
AWS Budgets can trigger a Lambda function when a threshold is breached. This lets you go beyond email alerts — you can automatically notify Slack, create Jira tickets, or even shut down resources.
Here’s a Lambda function that sends a formatted cost alert to Slack when a budget threshold is exceeded:
import json
import urllib3
import os
import boto3
from datetime import datetime, timedelta

SLACK_WEBHOOK = os.environ['SLACK_WEBHOOK_URL']
ACCOUNT_ID = os.environ['AWS_ACCOUNT_ID']
ce = boto3.client('ce')

def lambda_handler(event, context):
    """
    Triggered by AWS Budgets alert via SNS.
    Sends formatted cost alert to Slack with top spending services.
    """
    # Extract budget alert details
    alert = json.loads(event['Records'][0]['Sns']['Message'])
    budget_name = alert.get('BudgetName', 'Unknown')
    actual_spend = alert.get('ActualSpend', {}).get('Amount', '0')
    budget_limit = alert.get('BudgetLimit', {}).get('Amount', '0')
    currency = alert.get('ActualSpend', {}).get('Unit', 'USD')

    # Get top spending services for context
    end_date = datetime.now().strftime('%Y-%m-%d')
    start_date = (datetime.now() - timedelta(days=7)).strftime('%Y-%m-%d')

    try:
        cost_response = ce.get_cost_and_usage(
            TimePeriod={'Start': start_date, 'End': end_date},
            Granularity='MONTHLY',
            Metrics=['UnblendedCost'],
            GroupBy=[{'Type': 'DIMENSION', 'Key': 'SERVICE'}],
            QueryOptions={}
        )

        services = []
        for group in cost_response['ResultsByTime'][0]['Groups']:
            amount = float(group['Metrics']['UnblendedCost']['Amount'])
            if amount > 10:  # Only show services over $10
                services.append({
                    'service': group['Keys'][0],
                    'cost': f"${amount:,.2f}"
                })

        # Sort by cost descending
        services.sort(key=lambda x: float(x['cost'].replace('$', '').replace(',', '')), reverse=True)
        top_services = services[:5]
    except Exception:
        top_services = [{'service': 'Unable to fetch', 'cost': 'N/A'}]

    # Calculate percentage
    try:
        pct = (float(actual_spend) / float(budget_limit)) * 100
    except (ValueError, ZeroDivisionError):
        pct = 0

    # Build Slack message
    service_list = "\n".join(
        [f"  • {s['service']}: {s['cost']}" for s in top_services]
    )

    emoji = ":rotating_light:" if pct >= 100 else ":warning:" if pct >= 80 else ":moneybag:"

    slack_payload = {
        "text": f"{emoji} AWS Budget Alert: {budget_name}",
        "blocks": [
            {
                "type": "header",
                "text": {"type": "plain_text", "text": f"{emoji} Budget Alert: {budget_name}"}
            },
            {
                "type": "section",
                "fields": [
                    {"type": "mrkdwn", "text": f"*Actual Spend:*\n{currency} {float(actual_spend):,.2f}"},
                    {"type": "mrkdwn", "text": f"*Budget Limit:*\n{currency} {float(budget_limit):,.2f}"},
                    {"type": "mrkdwn", "text": f"*Utilization:*\n{pct:.1f}%"},
                    {"type": "mrkdwn", "text": f"*Account:*\n{ACCOUNT_ID}"}
                ]
            },
            {
                "type": "section",
                "text": {"type": "mrkdwn", "text": f"*Top Services (7-day):*\n{service_list}"}
            },
            {
                "type": "actions",
                "elements": [
                    {
                        "type": "button",
                        "text": {"type": "plain_text", "text": "Open Cost Explorer"},
                        "url": f"https://console.aws.amazon.com/costmanagement/home?account={ACCOUNT_ID}#/cost-explorer"
                    }
                ]
            }
        ]
    }

    # Send to Slack
    http = urllib3.PoolManager()
    response = http.request(
        'POST',
        SLACK_WEBHOOK,
        body=json.dumps(slack_payload),
        headers={'Content-Type': 'application/json'}
    )

    return {
        'statusCode': response.status,
        'body': json.dumps({'message': 'Alert sent', 'budget': budget_name})
    }
Deploy this Lambda with an IAM role that has ce:GetCostAndUsage permissions and a trigger from SNS. Then configure your AWS Budget to publish to that SNS topic:
# Create SNS topic for budget alerts
aws sns create-topic --name budget-alerts

# Subscribe the Lambda function to the topic
aws sns subscribe \
  --topic-arn arn:aws:sns:us-east-1:123456789012:budget-alerts \
  --protocol lambda \
  --notification-endpoint arn:aws:lambda:us-east-1:123456789012:function:cost-alert-handler

# Create a budget that alerts at 80% and 100%
aws budgets create-budget \
  --account-id 123456789012 \
  --budget '{
    "BudgetName": "MonthlyTotalBudget",
    "BudgetLimit": {"Amount": "5000", "Unit": "USD"},
    "TimeUnit": "MONTHLY",
    "TimePeriod": {"Start": "2026-01-01", "End": "2027-01-01"},
    "CostTypes": {"IncludeTax": true, "IncludeSubscription": true}
  }' \
  --notifications-with-subscribers '[
    {
      "Notification": {"NotificationType": "ACTUAL", "ComparisonOperator": "GREATER_THAN", "Threshold": 80},
      "Subscribers": [{"SubscriptionType": "SNS", "Address": "arn:aws:sns:us-east-1:123456789012:budget-alerts"}]
    },
    {
      "Notification": {"NotificationType": "ACTUAL", "ComparisonOperator": "GREATER_THAN", "Threshold": 100},
      "Subscribers": [{"SubscriptionType": "SNS", "Address": "arn:aws:sns:us-east-1:123456789012:budget-alerts"}]
    }
  ]'
The 80% alert gives your team a heads-up. The 100% alert means you’ve crossed the line. At that point, you need to decide whether to increase the budget or start cutting resources.
The cost monitoring pipeline
Here’s what a complete cost monitoring pipeline looks like, from data ingestion to automated response:
AWS Resources (EC2, RDS, S3, Lambda, etc.)
     |
     v
+--------------------------------------------------+
|  Cost & Usage Report (CUR 2.0)                   |
|  - Hourly granularity                             |
|  - Resource-level attribution                     |
|  - Tag-based cost allocation                      |
+--------------------------------------------------+
     |                        |                    |
     v                        v                    v
+----------------+   +----------------+   +-------------------+
| Cost Explorer  |   | AWS Budgets    |   | Cost Anomaly      |
| (Analysis)     |   | (Thresholds)   |   | Detection (ML)    |
+----------------+   +----------------+   +-------------------+
     |                        |                    |
     v                        v                    v
  Manual review         SNS Alert             SNS Alert
  (Weekly reports)      (80%/100% breach)     (Spike detected)
                                |                    |
                                v                    v
                         +-----------------------------------+
                         |  Lambda Function                  |
                         |  - Slack notification             |
                         |  - Top services breakdown         |
                         |  - Cost Explorer deep link        |
                         |  - Optional: auto-remediation     |
                         +-----------------------------------+
                                |
                                v
                         +-----------------------------------+
                         |  Team Response                    |
                         |  - Investigate anomaly            |
                         |  - Resize or terminate resources  |
                         |  - Update budget if legitimate    |
                         +-----------------------------------+
The pipeline runs continuously. Cost Anomaly Detection monitors in the background and fires within hours of a spike. Budgets check daily. Your team gets Slack notifications with enough context to act immediately.
Tagging: the foundation that makes everything else work
None of the monitoring tools work well without proper tagging. Cost Anomaly Detection operates at the account and service level, but when you get an alert that says “RDS spending is up $400,” you need to know which RDS instance, which team owns it, and which project it belongs to. Tags answer those questions.
A practical tagging strategy needs four things: required tags, enforcement, activation, and review.
Required tags for every resource:
Environment—production,staging,development,sandboxTeam— the team that owns the resource (e.g.,platform,data,backend)Project— the project or product this resource supportsCostCenter— the billing cost centerOwner— email of the person responsible
Enforcement means resources can’t be created without tags. Use Service Control Policies in AWS Organizations:
{
  "Version": "2012-10-17",
  "Statement": [
    {
      "Sid": "DenyUntaggedEC2",
      "Effect": "Deny",
      "Action": [
        "ec2:RunInstances",
        "rds:CreateDBInstance",
        "lambda:CreateFunction"
      ],
      "Resource": [
        "arn:aws:ec2:*:*:instance/*",
        "arn:aws:rds:*:*:db:*",
        "arn:aws:lambda:*:*:function:*"
      ],
      "Condition": {
        "Null": {
          "aws:RequestTag/Environment": "true",
          "aws:RequestTag/Team": "true",
          "aws:RequestTag/Project": "true"
        }
      }
    }
  ]
}
This SCP denies EC2 instance launches, RDS creation, and Lambda function creation unless the Environment, Team, and Project tags are present. It won’t catch every service, but it covers the three biggest cost drivers.
Activation means turning on cost allocation tags in the Billing console so they appear in Cost Explorer:
aws ce update-cost-allocation-tags-status \
  --cost-allocation-tags-status '[
    {"TagKey": "Environment", "Status": "Active"},
    {"TagKey": "Team", "Status": "Active"},
    {"TagKey": "Project", "Status": "Active"},
    {"TagKey": "CostCenter", "Status": "Active"}
  ]'
Review means checking tag compliance regularly. Run a weekly script that finds untagged resources:
# Find EC2 instances missing the Team tag
aws ec2 describe-instances \
  --filters "Name=tag:Team,Values=" \
  --query "Reservations[*].Instances[*].[InstanceId, Tags]" \
  --output table
If tagging discipline is new to your team, expect pushback. Developers will say it slows them down. It doesn’t. Adding four tags at launch takes thirty seconds. Finding who owns an untagged $3,000/month resource takes three days. For a deeper look at how tagging fits into the bigger FinOps picture, check out the FinOps Well-Architected guide.
Right-sizing: the gift that keeps giving
Cost Anomaly Detection tells you when spending spikes. Right-sizing tells you when you’re overspending even during “normal” operations. The two complement each other.
AWS Compute Optimizer analyzes CloudWatch metrics and recommends instance types that match your actual usage patterns. I’ve seen accounts where 40% of EC2 instances were over-provisioned. That’s not an anomaly — it’s a chronic condition that Anomaly Detection won’t catch because the spending is consistent.
# Get right-sizing recommendations
aws compute-optimizer get-ec2-instance-recommendations \
  --query 'instanceRecommendations[?finding==`Overprovisioned`].[instanceArn, currentInstanceType, recommendationOptions[0].instanceType, recommendationOptions[0].savingsOpportunity.savingsOpportunityPercentage]' \
  --output table
The output looks something like this:
------------------------------------------------------------------------------------------
|                                                  Instance Recommendations               |
------------------------------------------------------------------------------------------
|  arn:aws:ec2:...:i-0abc123  |  m5.2xlarge  |  m5.xlarge    |  50.0%               |
|  arn:aws:ec2:...:i-0def456  |  r5.4xlarge  |  r5.2xlarge   |  50.0%               |
|  arn:aws:ec2:...:i-0ghi789  |  c5.9xlarge  |  c5.4xlarge   |  55.6%               |
------------------------------------------------------------------------------------------
Three instances, potential savings of roughly $1,800/month. Not from anomalies — from consistent over-provisioning that nobody noticed because the bill was “normal.” For the full walkthrough on Compute Optimizer setup and reading recommendations, see the Compute Optimizer guide.
Real cost horror stories (and what would have caught them)
I collect these stories the way some people collect stamps. Here are a few from my own experience and from colleagues who were willing to share.
The $12,000 NAT Gateway: A data engineering team set up a nightly job that transferred 8TB of data from S3 to an EMR cluster. The VPC routing was misconfigured — instead of using a VPC endpoint (free for S3), the traffic was routed through a NAT Gateway. At $0.045/GB for data processing, that’s $360/night. Over a month, the NAT Gateway charges alone hit $10,800. Cost Anomaly Detection would have flagged the data transfer spike within 24 hours. A VPC endpoint would have eliminated it entirely.
The forgotten Redshift cluster: A team spun up a dc2.8xlarge Redshift cluster ($6.52/hour) for a one-week analysis project. The project finished. The cluster kept running. Four months later, someone noticed while doing a quarterly cost review. Total waste: approximately $19,000. Anomaly Detection would have caught it in week one. A simple Budget alert set to $1,000/month for the Redshift service would have flagged it even sooner.
The auto-scaling feedback loop: An application had a CloudWatch alarm that triggered scale-up when CPU exceeded 80%. The problem: the health check endpoint was computationally expensive. When the auto-scaling group added instances, each new instance increased load on the database, which increased response times, which caused more CPU usage, which triggered more scaling. The group went from 4 instances to 47 instances in six hours. At $0.096/hour per instance, the extra 43 instances cost $99/day. Over a long weekend when nobody was watching: $300. Not catastrophic, but completely unnecessary. Anomaly Detection would have flagged the EC2 spend spike within the first few hours.
The Bedrock experiment: A team built an internal chatbot using Amazon Bedrock. They tested it with a small group — worked great. Then they opened it to the entire company without rate limiting. Within a week, Bedrock inference costs went from $50/day to $2,100/day. The model was processing 40,000 requests daily, many of which were employees testing it with trivial queries. Anomaly Detection caught it on day three. They added a rate limiter and a per-user quota, and costs dropped back to $80/day.
Cost optimization checklist with estimated savings
This checklist covers the highest-impact actions for reducing your AWS bill. I’ve ordered it roughly by effort-to-savings ratio — start at the top and work down.
| Action | Estimated Savings | Effort | Tools |
|---|---|---|---|
| Enable Cost Anomaly Detection | Prevents surprises, saves $500-$10K+ per incident | 30 minutes | AWS Cost Anomaly Detection |
| Set up Budget alerts at 80%/100% | Prevents overruns, catches issues within 24 hours | 1 hour | AWS Budgets, SNS, Lambda |
| Right-size over-provisioned EC2 instances | 20-50% on resized instances | 2-4 hours per instance | Compute Optimizer |
| Buy Compute Savings Plans for 24/7 workloads | 30-66% off On-Demand | 2 hours analysis + commitment | AWS Savings Plans |
| Delete unattached EBS volumes | $0.08-$6.00/volume/month | 30 minutes | AWS CLI, Trusted Advisor |
| Clean up old EBS snapshots | $0.05/GB/month per snapshot | 1 hour (automate with lifecycle) | DLM, Lambda |
| Add S3 lifecycle rules | 30-70% on storage costs over time | 2-4 hours per bucket | S3 Lifecycle Configuration |
| Use S3 Intelligent-Tiering | Up to 40% on objects with unknown access patterns | 1 hour per bucket | S3 Console or CLI |
| Replace NAT Gateway with VPC Endpoints | Eliminates $0.045/GB data processing for S3/DynamoDB | 2-4 hours per VPC | VPC Endpoints |
| Enable S3 Requester Pays for shared data | Shifts costs to data consumers | 1 hour per bucket | S3 Console |
| Switch to Graviton instances (m6g, r6g, c6g) | 20% better price-performance vs. x86 | 4-8 hours per application | EC2, Compute Optimizer |
| Schedule non-production instances off-hours | 60-70% savings on dev/staging compute | 2-3 hours (automate with Lambda or Instance Scheduler) | Lambda, EventBridge |
| Implement tag-based cost allocation | Enables team-level accountability | 1-2 days (policy + enforcement) | SCPs, Cost Allocation Tags |
| Review and terminate idle RDS instances | $15-$6,500/month per instance | 2 hours | Trusted Advisor, RDS Console |
The numbers come from real optimizations across multiple accounts. Your mileage varies based on your workload, region, and current spending. The total impact of implementing all of these on an account spending $50K/month typically lands between $8,000 and $18,000 in monthly savings — roughly 15-35%.
For the discount purchasing strategies, the Savings Plans vs Reserved Instances comparison breaks down when each discount model makes sense and what the actual discount rates look like in 2026.
Setting up the full monitoring stack
Here’s the step-by-step process to go from zero cost visibility to a complete monitoring pipeline. This takes about half a day.
Step 1: Enable Cost Anomaly Detection (15 minutes)
Create monitors for your account and for each major service. Add SNS subscriptions so alerts reach your team.
Step 2: Set up Budgets with automated notifications (30 minutes)
Create a monthly budget. Set alerts at 50% (informational), 80% (warning), and 100% (critical). Connect the 80% and 100% alerts to the Lambda function that sends Slack notifications.
Step 3: Activate cost allocation tags (15 minutes)
Activate the Environment, Team, Project, and CostCenter tags in the Billing console. Note that this only affects data going forward — historical cost data won’t retroactively include tags.
Step 4: Deploy the tagging enforcement SCP (30 minutes)
Apply the SCP to your AWS Organization OUs. Test it by trying to launch an untagged instance — it should be denied.
Step 5: Enable Compute Optimizer (15 minutes)
Enable it for your organization. Wait 14 days for recommendations to populate. Review the findings and create a plan to address over-provisioned instances.
Step 6: Create a weekly cost review process (30 minutes)
Set a recurring calendar event. Use Cost Explorer to review week-over-week spending changes. Look for services where costs increased more than 10% without a corresponding increase in traffic or usage.
Step 7: Automate cleanup for obvious waste (1-2 hours)
Write Lambda functions or use AWS-native tools to automatically delete unattached EBS volumes, clean up old snapshots, and stop non-production instances outside business hours. These are low-risk actions with consistent savings.
When to escalate beyond native tools
AWS-native cost tools work well for single-cloud AWS environments. You should consider third-party tools when:
- Multi-cloud visibility: You’re running workloads on AWS, Azure, and GCP and need a unified cost dashboard. Tools like CloudHealth, Apptio, or Vantage give you a single view across providers.
- Unit cost economics: You need to understand cost per customer, cost per transaction, or cost per feature. AWS Cost Explorer shows you cost per service, but mapping that to business units requires either custom tagging or a third-party tool.
- Kubernetes cost allocation: Running EKS? Kubecost or the OpenCost project gives you pod-level and namespace-level cost visibility that AWS doesn’t provide natively.
- Collaborative budgeting: When finance, engineering, and product teams all need to view and manage budgets, purpose-built FinOps platforms provide role-based access and approval workflows.
- Real-time anomaly detection: AWS Anomaly Detection operates on daily granularity. If you need sub-hourly alerts (for example, a runaway auto-scaling event), you need custom CloudWatch alarms or a third-party tool.
The FinOps Foundation reports that organizations with mature FinOps practices save 20-30% on cloud spend compared to those without structured cost management. Their State of FinOps report is worth reading if you’re building a cost management program from scratch. Gartner also notes that through 2027, 60% of infrastructure and operations leaders will have cost optimization as their primary objective — up from less than 30% in 2023.
The bottom line
AWS cost surprises are preventable. Every horror story I’ve shared — including my own — could have been caught early with the tools that AWS provides for free. The pattern is always the same: someone provisions something, nobody monitors it, and the bill arrives weeks later with a surprise.
The fix isn’t complicated. Enable Cost Anomaly Detection. Set up Budget alerts. Tag your resources. Right-size your instances. Automate cleanup. Review weekly. That’s it. The entire setup takes half a day and saves thousands of dollars per month.
The hardest part isn’t the technology. It’s the discipline. Cost monitoring only works if you keep doing it. Alerts only matter if someone reads them. Recommendations only save money if someone acts on them. Build the pipeline, assign ownership, and make cost review a regular part of your engineering workflow.
Start with Cost Anomaly Detection — it’s free, it takes 15 minutes, and it might save you $5,200 on your next surprise.
Explore more like this

Aurora Serverless v2 + Bedrock: AI Database Queries in 2026
I connected Bedrock to our Aurora cluster last month. The first thing I asked it was “show me all customers who churned in Q1 but came back in Q2” —...
Terraform State Locking with S3 and DynamoDB in 2026
The moment two engineers run terraform apply at the same time without state locking, you have a race condition that can corrupt your entire infrastructure state. Both processes read the...


Comments