Datadog vs CloudWatch vs Grafana: Observability Showdown for AWS 2026
I’ve run all three in production. Not in a lab, not in a POC that got abandoned after two weeks. Datadog on a fleet of 200 ECS services. CloudWatch on everything AWS because you literally can’t avoid it. Grafana with Prometheus on EKS clusters that serve millions of requests per day. Each one taught me something the others couldn’t, and each one has a billing surprise waiting if you aren’t paying attention.
This isn’t a “pick the best tool” post, because there is no best tool. There’s the right tool for your team size, your AWS footprint, your budget, and your tolerance for building versus buying. What I can do is tell you exactly what each one does well, where each one falls short, and what the real costs look like after you’ve been running for six months.
The Three Contenders in 30 Seconds
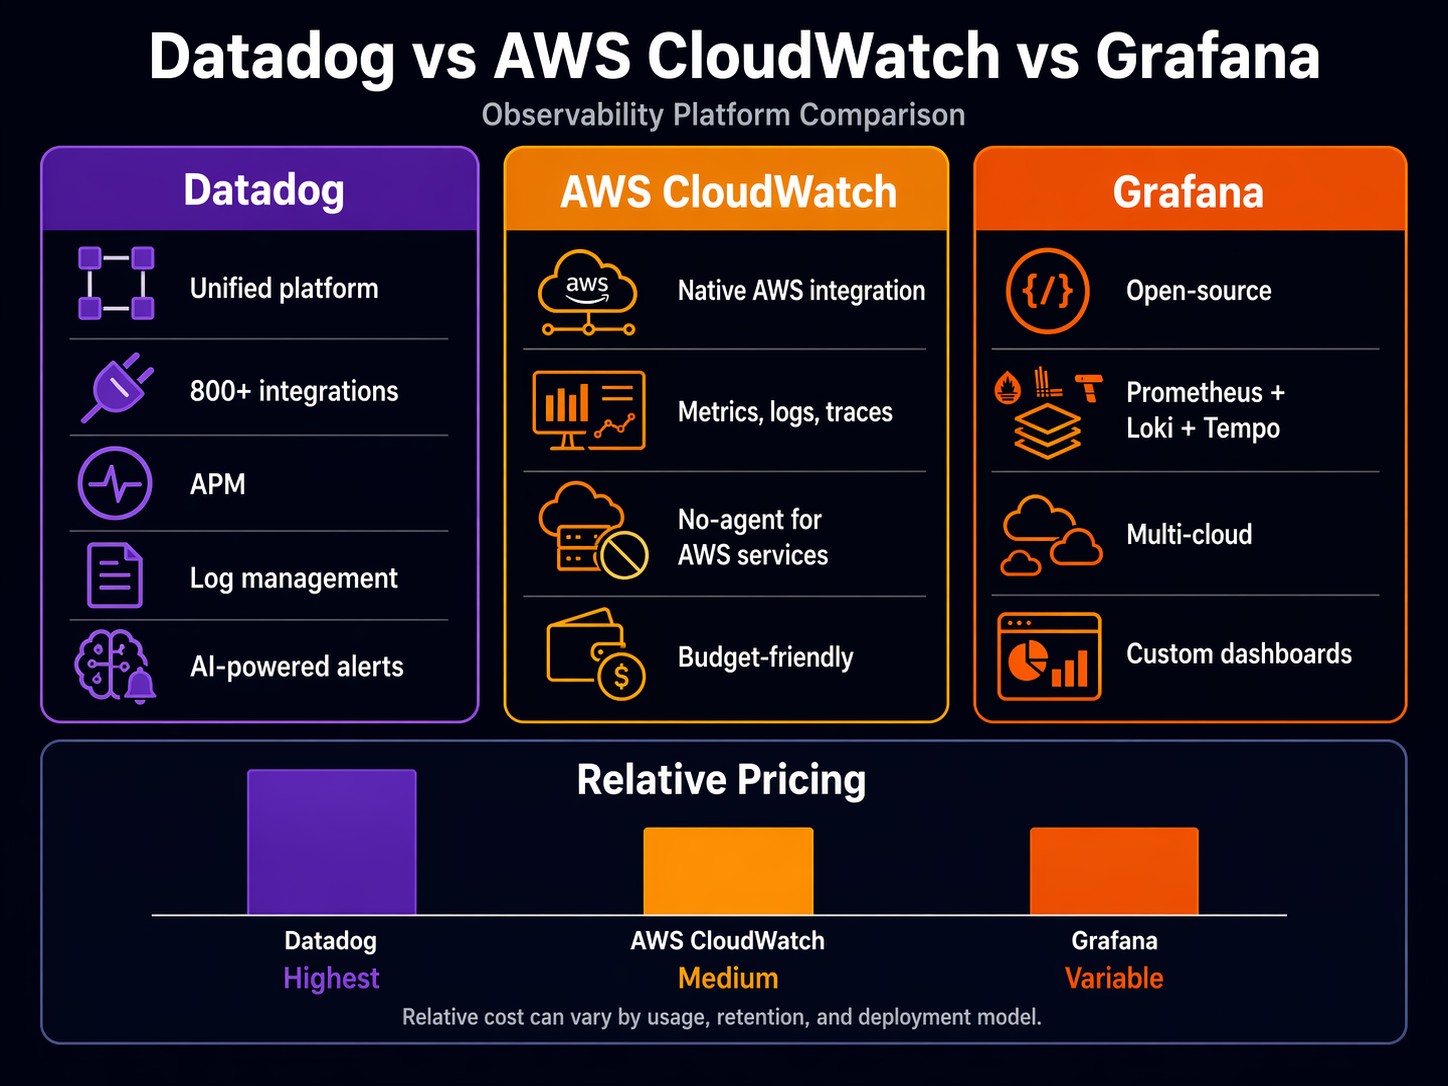
Datadog is the all-in-one commercial platform. Metrics, logs, traces, dashboards, alerts, APM, synthetic monitoring, security — it does everything, it integrates with everything, and it charges for everything. It’s the observability platform most teams wish they could afford.
CloudWatch is AWS’s built-in monitoring service. Every AWS resource pushes metrics to CloudWatch automatically. It handles logs, metrics, alarms, and dashboards natively. You already have it. The question is whether it’s enough on its own.
Grafana is the open-source visualization layer that pairs with Prometheus (metrics), Loki (logs), and Tempo (traces). Grafana Cloud wraps all of that into a managed service. It’s the choice for teams that want flexibility and control over their telemetry pipeline.
If you want the deep technical walkthrough on any individual tool, I’ve written standalone guides: AWS CloudWatch deep dive, Prometheus and Grafana on EKS, and AWS X-Ray distributed tracing. This post is about comparing them head to head.
Feature Comparison Matrix
Let’s start with the raw capabilities.
| Feature | Datadog | CloudWatch | Grafana Cloud |
|---|---|---|---|
| Metrics | Custom + 850+ integrations | AWS built-in + custom metrics | Prometheus-compatible, any source |
| Logs | Log Management (separate product) | CloudWatch Logs + Logs Insights | Loki (separate product) |
| Traces | APM (separate product) | X-Ray integration | Tempo (separate product) |
| Dashboards | Rich, drag-and-drop, shared | Functional, limited widgets | Best-in-class, community templates |
| Alerting | Multi-condition, ML anomaly detection | Metric alarms, composite alarms | Unified alerting with Alertmanager |
| Synthetic Monitoring | Built-in | CloudWatch Synthetics (separate) | Grafana Synthetic Monitoring (add-on) |
| Infrastructure Map | Service map, network map | X-Ray service map | Limited (needs external service discovery) |
| APM / Profiling | Built-in, continuous profiler | CodeGuru Profiler (separate) | Pyroscope integration (add-on) |
| Security | Cloud Security Platform | Security Hub + GuardDuty (separate) | Not included |
| Mobile App | Yes, full-featured | Console Mobile (limited) | Yes |
| API / Terraform | Full Terraform provider | Full Terraform provider | Terraform + GitOps (native) |
| Free Tier | 5 hosts, 1 day retention | 10 metrics, 5GB logs, 3 dashboards | 10K series, 50GB logs, 50GB traces |
Datadog wins on breadth. There’s no other way to say it. If you want one platform that covers metrics, logs, traces, security, synthetics, and profiling without bolting together separate services, Datadog does that. But every column in that table is a separate line item on the invoice.
CloudWatch is deeper than most engineers realize. The problem isn’t capability — it’s discoverability. CloudWatch Application Signals, Logs Insights, and Container Insights are genuinely powerful. They’re just buried under the AWS console’s organizational chaos. Read the CloudWatch deep dive if you haven’t, because you’re probably paying for Datadog to do things CloudWatch already does.
Grafana’s strength is flexibility. You aren’t locked into any data source. Want to visualize CloudWatch metrics alongside Prometheus metrics in the same dashboard? Grafana does that natively. No other tool makes multi-source correlation this easy.
Pricing: The Part Nobody Wants to Talk About
This is where the comparison gets real. Published pricing doesn’t tell the full story because every tool has dimensions that scale in ways you don’t expect.
| Cost Dimension | Datadog | CloudWatch | Grafana Cloud |
|---|---|---|---|
| Infrastructure (per host/mo) | $15 (Pro) / $23 (Enterprise) | $0 (built into AWS) | $0 (usage-based) |
| APM (per host/mo) | $31+ (additional) | $0 (X-Ray, pay per trace) | $0 (included in traces tier) |
| Log Ingestion (per GB) | $0.10–$0.30/GB indexed | $0.50/GB ingested | $0.50/GB (logs tier) |
| Custom Metrics | First 1,000 free, then ~$5.00/mo per 100 | $0.30/mo per metric | Included in series allocation |
| Dashboard | Included | $3.00/dashboard/mo | Included |
| Alarms | Included | $0.10/alarm/mo | Included |
| Trace Storage | 15 months included | $0.50 per million traces | Usage-based |
| Retention (default) | 15 months metrics, 30 days logs | 15 months (rolled up), configurable logs | Configurable per tier |
| Data Transfer | No AWS egress | No egress (same region) | Prometheus remote write egress |
Sources: Datadog Pricing, AWS CloudWatch Pricing, Grafana Cloud Pricing.
The Hidden Cost Vectors
Let me walk through a real scenario. Say you have 50 EC2 instances and 20 ECS services, pushing about 500GB of logs per month and running 5,000 custom metrics.
Datadog: Infrastructure at $15/host x 50 = $750/mo. APM at $31/host x 50 = $1,550/mo. Log management at ~$0.20/GB x 500GB = $100/mo. Custom metrics: 5,000 minus 1,000 free = 4,000 at roughly $5/100 = $200/mo. Total: roughly $2,600/mo before you add security, synthetic monitoring, or any of the other products. Realistic total for a mid-size deployment lands between $3,000–$5,000/mo.
CloudWatch: Custom metrics: 5,000 x $0.30 = $1,500/mo. Log ingestion: 500GB x $0.50 = $250/mo. Dashboards: say 10 dashboards x $3 = $30/mo. Alarms: 50 alarms x $0.10 = $5/mo. Total: roughly $1,785/mo. But your EC2 metrics, Lambda metrics, RDS metrics, and most AWS service metrics are already included. The shock is usually custom metrics — teams that push thousands of application-level metrics see that $0.30/mo per metric multiply fast.
Grafana Cloud: With the Pro tier at roughly $29/mo per stack (includes 10K series, 50GB logs, 50GB traces), you’d need to add capacity for 500GB of logs. The per-GB pricing varies, but expect $0.50/GB for additional logs. If you self-manage Prometheus on EKS, the compute cost for the Prometheus servers is on your AWS bill, not Grafana’s. A realistic total for this scenario: $800–$1,500/mo depending on whether you use Grafana Cloud for everything or self-manage the metrics tier.
The pricing lesson: Datadog is the most expensive but the most predictable (per-host pricing). CloudWatch is cheapest for pure AWS metrics but custom metrics and log queries can surprise you. Grafana Cloud is in the middle, but you need to account for the operational cost of managing Prometheus if you self-host.
Setup Complexity: Time to First Useful Dashboard
How long does it take to go from zero to a dashboard that tells you something useful during an incident?
| Setup Dimension | Datadog | CloudWatch | Grafana Cloud |
|---|---|---|---|
| Agent Install | 1 command (Datadog Agent) | CloudWatch Agent (manual config) | Grafana Agent or OTel Collector |
| AWS Integration | Pre-built AWS integration (20 min) | Automatic for native services | Manual IAM role + scraping config |
| Dashboard Creation | Pre-built templates + drag-drop | Automatic dashboards per service | Community templates + custom panels |
| Log Collection | Agent auto-discovers log files | Agent config or Lambda layer | Agent config + Loki pipeline |
| APM Setup | Agent + language-specific tracer | X-Ray SDK or ADOT Collector | OTel Collector + Tempo |
| Alerting | 30+ notification integrations | SNS + Lambda (functional) | Alertmanager + multiple channels |
| IAM / Auth | SSO, RBAC, API keys | IAM roles, resource-based policies | SSO, RBAC (Pro tier and above) |
| Terraform Support | Mature, well-documented | Mature, well-documented | Mature, GitOps-native |
| Time to First Dashboard | ~30 minutes | ~1 hour | ~2 hours (self-managed) / ~45 min (Cloud) |
Datadog wins the setup race. Install the agent, plug in your AWS credentials, and you have dashboards in 20 minutes. The agent auto-discovers running services, containers, and processes. It’s genuinely impressive.
CloudWatch is already there for AWS services — you have Lambda dashboards whether you want them or not. But getting application-level metrics and logs from ECS or EC2 requires the CloudWatch Agent, which means writing a configuration file by hand. Not hard, just tedious.
Grafana requires the most upfront work if you’re self-managing Prometheus. You need to deploy Prometheus, configure scraping targets, set up the Grafana agent for logs, and wire it all together. With Grafana Cloud, the setup is faster because they manage the storage layer, but you still need to configure the agent and scraping targets. If you’re running EKS, the Prometheus and Grafana EKS guide walks through the full setup.
Configuration Snippets
Here’s what the agent setup looks like for each tool on an EC2 instance.
Datadog Agent — one command and an API key:
DD_API_KEY=your-api-key DD_SITE="datadoghq.com" \
  bash -c "$(curl -L https://s3.amazonaws.com/dd-agent/scripts/install_script_agent7.sh)"
That’s it. The agent starts collecting system metrics, auto-discovers Docker containers, and reports back. For ECS or EKS, you deploy the agent as a DaemonSet with a Helm chart.
CloudWatch Agent — install and write a config file:
# Install the agent
sudo yum install amazon-cloudwatch-agent -y

# Generate config (interactive wizard)
sudo /opt/aws/amazon-cloudwatch-agent/bin/amazon-cloudwatch-agent-config-wizard

# Or use a pre-built config
cat > /opt/aws/amazon-cloudwatch-agent/etc/amazon-cloudwatch-agent.json << 'EOF'
{
  "metrics": {
    "metrics_collected": {
      "cpu": { "measurement": ["cpu_usage_idle", "cpu_usage_user"] },
      "mem": { "measurement": ["mem_used_percent", "mem_available_percent"] },
      "disk": { "measurement": ["used_percent"], "resources": ["/"] }
    }
  },
  "logs": {
    "logs_collected": {
      "files": {
        "collect_list": [
          {
            "file_path": "/var/log/app/*.log",
            "log_group_name": "/myapp/logs",
            "log_stream_name": "{instance_id}"
          }
        ]
      }
    }
  }
}
EOF

sudo /opt/aws/amazon-cloudwatch-agent/bin/amazon-cloudwatch-agent-ctl \
  -a fetch-config -m ec2 -c file:/opt/aws/amazon-cloudwatch-agent/etc/amazon-cloudwatch-agent.json -s
More configuration, but no external dependency. Everything stays within AWS.
Grafana Agent — config file and systemd:
# /etc/grafana/agent.yaml
metrics:
  wal_directory: /var/lib/grafana-agent/wal
  global:
    scrape_interval: 15s
  configs:
    - name: default
      remote_write:
        - url: https://your-grafana-cloud-endpoint/api/prom/push
          basic_auth:
            username: your-user-id
            password: your-api-key
      scrape_configs:
        - job_name: node
          static_configs:
            - targets: ['localhost:9100']

logs:
  configs:
    - name: default
      clients:
        - url: https://your-grafana-cloud-endpoint/loki/api/v1/push
          basic_auth:
            username: your-user-id
            password: your-api-key
      positions:
        filename: /var/lib/grafana-agent/positions.yaml
      scrape_configs:
        - job_name: app
          static_configs:
            - targets: ['localhost']
              labels:
                job: app
                __path__: /var/log/app/*.log
More verbose, but also more explicit. You can see exactly where every piece of data goes. That’s the Grafana philosophy — verbose but transparent.
AWS Integration Depth
This is where CloudWatch has an unfair advantage. It’s an AWS service talking to other AWS services.
| AWS Integration | Datadog | CloudWatch | Grafana Cloud |
|---|---|---|---|
| Lambda | Agent extension + layers | Native, zero-config | Grafana Agent extension |
| ECS/Fargate | Agent sidecar or DaemonSet | Native via task logs, Container Insights | Agent sidecar + adot collector |
| EKS | Helm chart, full cluster monitoring | Container Insights + ADOT | Prometheus scraping native, agent DaemonSet |
| API Gateway | AWS integration pull | Native metrics + access logs | CloudWatch data source plugin |
| DynamoDB | AWS integration pull | Native metrics | CloudWatch data source plugin |
| S3 | AWS integration pull | Request metrics + access logs | CloudWatch data source plugin |
| SQS/SNS | AWS integration pull | Native metrics | CloudWatch data source plugin |
| RDS | AWS integration + enhanced monitoring | Native + Enhanced Monitoring, Performance Insights | CloudWatch data source plugin |
| CloudFront | AWS integration pull | Native metrics + real-time logs | CloudWatch data source plugin |
| Network Firewall | AWS integration pull | Native flow logs + metrics | CloudWatch data source plugin |
| IAM Auth | API key or IAM role | Native IAM, resource policies | API key or IAM (via plugin) |
CloudWatch wins depth, obviously. Every new AWS service launches with CloudWatch support on day one. Datadog’s AWS integration is excellent — it pulls data from CloudWatch and adds its own agent-based metrics — but there’s always a lag for brand-new services.
Grafana’s approach is different. For AWS metrics, you point Grafana at CloudWatch using the CloudWatch data source plugin. It works well, but you’re reading CloudWatch data through Grafana rather than collecting it directly. For Kubernetes workloads on EKS, Grafana shines because Prometheus scrapes metrics directly from pods — no CloudWatch middleman. This is covered in detail in the EKS monitoring guide.
The practical difference: if you’re running a pure AWS stack (Lambda, API Gateway, DynamoDB, SQS), CloudWatch gives you the deepest integration with the least effort. If you’re running Kubernetes on EKS with a mix of AWS and non-AWS services, Grafana’s Prometheus-native approach gives you better visibility into your pods and services. If you want everything in one place regardless of source, Datadog pulls from both and adds its own agent data.
Where Each Tool Actually Shines
When to Pick Datadog
Datadog is the right choice when your team values time over money and you need one pane of glass for everything.
I ran Datadog at a company with 200+ microservices spread across ECS, Lambda, and a few legacy EC2 instances. The infrastructure map alone justified the cost. During an incident, you could see which services were degraded, trace it to the specific database query causing the slowdown, and pull the exact log lines — all without switching tools. That correlation speed saves hours per incident.
The APM continuous profiler is genuinely useful. It shows you which functions consume the most CPU and memory over time, not just at a point-in-time snapshot. I’ve used it to find a regex that was catastrophically backtracking on certain inputs — something no metric or log would have caught.
The downside is cost predictability. Every feature is a separate product. Want logs? That’s extra. Want APM? Extra. Want security monitoring? Extra. The per-host pricing sounds reasonable until you realize you’re paying per host per product. A 50-host deployment with infrastructure, APM, and logs easily crosses $3,000/mo.
Pick Datadog if: Your team is smaller than 20 people managing a large fleet, you need correlated metrics-logs-traces out of the box, and your budget is approved.
When CloudWatch Is Enough
CloudWatch is the right choice when you’re all-in on AWS and your team is comfortable with the AWS console.
Here’s the thing most vendors won’t tell you: CloudWatch has gotten significantly better. Application Signals gives you service-level objectives and dashboards. Container Insights gives you ECS and EKS metrics without installing anything. Logs Insights is a powerful query engine for log analysis. OpenTelemetry integration with CloudWatch means you can use vendor-neutral instrumentation that exports to CloudWatch.
The problem is that CloudWatch’s strength is also its weakness. It only works well within the AWS ecosystem. If you have services running outside AWS — GCP, on-prem databases, SaaS tools — CloudWatch can’t see them. And the console experience for correlating metrics, logs, and traces during an incident is clunky compared to Datadog or Grafana.
The other issue is that CloudWatch costs are sneaky. AWS services push metrics for free, but custom metrics are $0.30/mo each. That sounds cheap until you have 10,000 of them. Log storage with no default retention means you’re paying for logs nobody has looked at in months. I’ve seen CloudWatch bills that exceeded what Datadog would have cost, simply because nobody set retention policies or trimmed custom metrics.
Pick CloudWatch if: You’re running a pure AWS stack, your observability needs are straightforward (you mostly need to know when things break), and you want zero vendor lock-in beyond what you already have with AWS.
When Grafana Is the Answer
Grafana is the right choice when you want control over your telemetry pipeline and you’re willing to invest in building it.
The Grafana ecosystem — Prometheus for metrics, Loki for logs, Tempo for traces — is powerful because it’s composable. You pick the pieces you need, you configure them how you want, and you own the data. No vendor can change the pricing model on you or deprecate a feature you depend on.
Grafana’s dashboards are the best in the industry. Not because they’re prettier (they are), but because the panel system is genuinely flexible. You can mix time series, stat panels, tables, logs, and traces in the same dashboard. Community dashboards give you starting points for almost any technology. And the templating system — variables that let you switch between environments, clusters, or services with a dropdown — is something neither Datadog nor CloudWatch matches.
The tradeoff is operational burden. Self-managing Prometheus means you’re responsible for storage, scaling, high availability, and upgrades. If Prometheus goes down, your monitoring goes down. That’s a uncomfortable irony — your monitoring system is a production system that needs its own monitoring. Grafana Cloud removes most of this burden by managing the storage and compute for you, but you’re still responsible for the agent configuration and scraping targets.
Grafana also shines in multi-cloud and hybrid environments. If you’re running services on AWS, GCP, and Azure simultaneously, Grafana is the only tool that treats all of them as first-class data sources. Datadog can pull from all three, but Grafana’s native Prometheus model is better suited for heterogeneous infrastructure.
Pick Grafana if: You have Kubernetes workloads, you value open-source and avoiding vendor lock-in, and you have the engineering capacity to manage the stack (or you’re willing to pay for Grafana Cloud’s managed offering).
The Hybrid Approach Most Teams End Up With
Most production teams I’ve worked with don’t use just one. They use two.
The most common pattern: CloudWatch for AWS native metrics and logs (because it’s already there and free for basic usage) plus Grafana for application metrics and dashboards. Prometheus scrapes your application metrics directly, giving you sub-second granularity that CloudWatch’s 1-minute default can’t match. You use CloudWatch Logs for audit trails and AWS service logs, and Loki for application logs that need correlation with Prometheus metrics.
The second most common: CloudWatch for AWS infrastructure plus Datadog for APM and log correlation. This gives you the AWS-native metrics you already have, plus Datadog’s superior trace-to-log-to-metric correlation for application debugging.
I’ve seen the all-Datadog approach work well at companies that can afford it. I’ve seen the all-CloudWatch approach work at companies with straightforward architectures and tight budgets. I’ve rarely seen the all-Grafana approach work without at least one dedicated platform engineer maintaining the stack.
Tracing: The Differentiator
Distributed tracing is where the three tools diverge most significantly.
Datadog’s APM is the most polished. Auto-instrumentation for most languages works out of the box. The trace viewer shows flame graphs with span tags, and clicking a span pulls the associated logs automatically. The continuous profiler adds memory and CPU profiling data to traces, which is something neither CloudWatch nor Grafana does natively.
CloudWatch relies on AWS X-Ray for distributed tracing, which is functional but less intuitive. The service map is useful, but the trace detail view isn’t as rich as Datadog’s. X-Ray pricing is pay-per-trace, which can work in your favor (low traffic = low cost) or against you (high traffic = pay more to see more). The integration with CloudWatch ServiceLens ties traces to metrics and logs, but the experience feels bolted together compared to Datadog’s native integration.
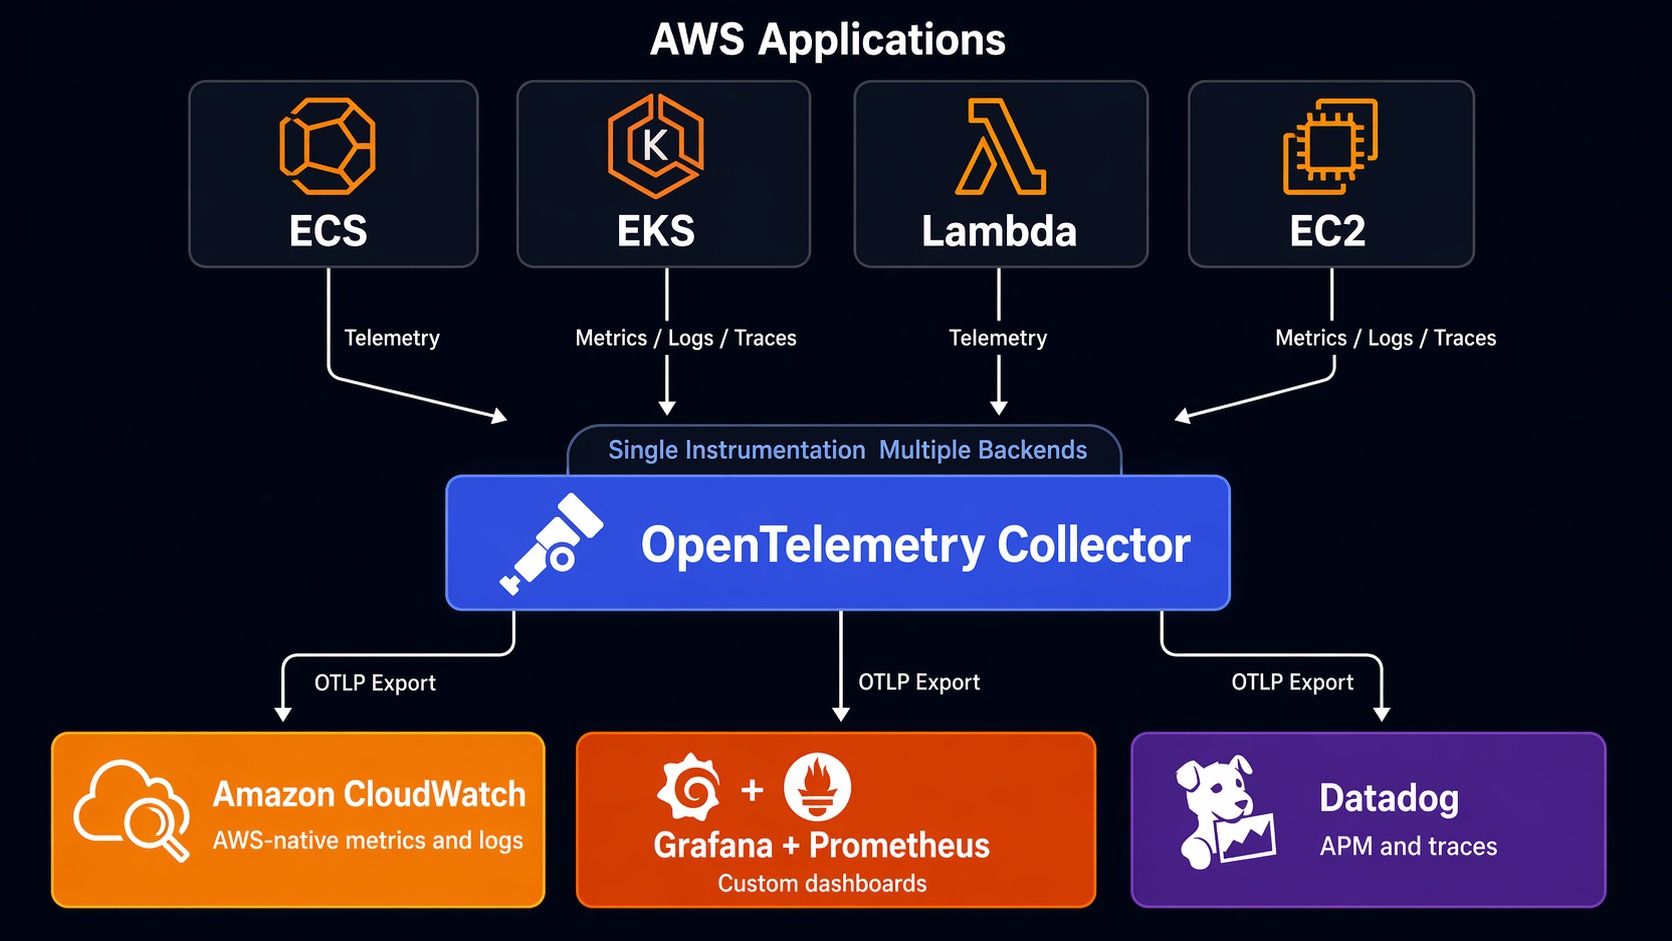
Grafana Tempo with OpenTelemetry is the most flexible. You instrument with OTel (vendor-neutral), send traces to Tempo, and view them in Grafana. The trace-to-log correlation works well if you configure Trace ID propagation correctly. You’re not locked into any vendor’s instrumentation. If you already read the OpenTelemetry + CloudWatch guide, you know OTel lets you export to any backend — including sending to both CloudWatch and Grafana simultaneously.
Here’s a quick OTel Collector config that routes traces to multiple backends:
# OTel Collector — export to multiple backends
receivers:
  otlp:
    protocols:
      grpc:
        endpoint: 0.0.0.0:4317

processors:
  batch:
    timeout: 5s
    send_batch_size: 1024

exporters:
  awsxray:
    region: us-east-1
  otlphttp:
    endpoint: https://your-grafana-cloud-endpoint:443
    headers:
      authorization: Basic your-encoded-creds

service:
  pipelines:
    traces:
      receivers: [otlp]
      processors: [batch]
      exporters: [awsxray, otlphttp]
This is the real power of OpenTelemetry. You aren’t choosing between tools. You’re choosing how to route your data. Start with both and optimize later.
Decision Framework
Here’s how I’d decide if I were starting fresh today:
Team of 1–5 engineers, pure AWS, budget-sensitive: Start with CloudWatch. Use Application Signals, Container Insights, and Logs Insights. Add OpenTelemetry instrumentation from the start so you can migrate later without rewriting code. Re-evaluate when your team grows past 10 engineers or your incident response time suffers.
Team of 5–20 engineers, mixed workloads, need speed: Get Datadog. The cost hurts but the time savings during incidents are real. A P90 incident response time of 30 minutes with Datadog versus 2 hours with CloudWatch means the tool pays for itself in avoided downtime. Use the free tier to validate before committing.
Team of 10+ engineers, Kubernetes-heavy, value open-source: Grafana Cloud with Prometheus and OTel. You get the best dashboards, vendor-neutral instrumentation, and the flexibility to add or change backends without rewriting code. Budget for at least 0.5 FTE to maintain the pipeline, or pay for Grafana Cloud’s fully managed tier.
Enterprise, compliance-heavy, multi-cloud: Datadog for unified visibility with Grafana as a secondary dashboard layer for teams that need custom views. CloudWatch handles AWS-native compliance and audit logging.
The Honest Take
After running all three in production across different companies and team sizes, here’s what I’d say:
CloudWatch is better than its reputation. Most engineers who dismiss it haven’t used Application Signals or Container Insights. It’s not a full observability platform, but for AWS-native workloads, it covers 70% of what you need at 20% of the cost of alternatives.
Datadog is expensive and worth it — if you actually use the correlation features. If your team just looks at dashboards and doesn’t use the trace-to-log-to-metric linking, you’re overpaying. The ROI shows up during incidents, not during normal operations.
Grafana is the best long-term bet if you’re willing to invest. OpenTelemetry + Prometheus + Grafana is the stack that gives you the most flexibility and the least vendor lock-in. It’s more work to set up and maintain, but it’s the stack that scales with your career, not just your current job.
The observability market is consolidating fast. Datadog keeps adding features (and prices). AWS keeps improving CloudWatch. Grafana Labs keeps building commercial products on top of open-source foundations. None of these tools is going away. Pick based on your team’s actual needs today, instrument with OpenTelemetry so you can switch tomorrow, and revisit every 12 months.
The worst choice isn’t picking the wrong tool. It’s not having observability at all. Start somewhere. Iterate. Your production users are counting on it.
Sources
- Datadog Pricing — per-host and per-product pricing details
- AWS CloudWatch Pricing — per-metric, per-GB, and per-alarm costs
- Grafana Cloud Pricing — tiered plans with usage-based pricing
- Gartner Magic Quadrant for Observability Platforms — independent evaluation of observability vendors
- Forrester Wave: Observability — comparative analysis of monitoring platforms
- OpenTelemetry Documentation — vendor-neutral instrumentation standard
Explore more like this
Aurora Serverless v2 + Bedrock: AI Database Queries in 2026
I connected Bedrock to our Aurora cluster last month. The first thing I asked it was “show me all customers who churned in Q1 but came back in Q2” —...
Terraform State Locking with S3 and DynamoDB in 2026
The moment two engineers run terraform apply at the same time without state locking, you have a race condition that can corrupt your entire infrastructure state. Both processes read the...

Comments