Load Testing on AWS: k6, Locust, and Distributed Performance Testing Guide
You do not know your system’s limits until you hit them in production. That sentence costs companies real money every quarter. I have seen teams ship to production with nothing more than a Postman collection and a prayer, only to watch their ALB return 503s during a product launch because nobody tested what happens at 10,000 concurrent connections.
Load testing is not optional. It is the difference between a launch that scales and a launch that becomes a postmortem. This guide covers everything you need to build a serious load testing practice on AWS: which tools to pick, how to architect distributed test runners, how to integrate with auto scaling, and how to do it without burning through your AWS budget.
Why Load Testing Matters in 2026
Let’s be honest about user patience – it’s basically gone. Google’s 2024 benchmark data still shows 53% of mobile users bailing on sites that take longer than 3 seconds. What’s shifted, though, is the sheer scale of traffic spikes. They hit harder and with less warning. One viral tweet and boom – 50,000 concurrent users hammering your API before lunch.
And the downtime math gets ugly fast. Picture an e-commerce platform clearing $100K per hour. A 30-minute outage at peak? That’s $50,000 in sales just… gone. Never mind the churn, the flood of support tickets, and the trust damage that lingers for months.
These days, SLOs and SLAs demand actual evidence. Slapping “99.9% availability” and “sub-200ms p99 latency” in a contract sounds great until someone asks for the numbers. Load testing gives you that proof before your users do it for you – loudly and publicly.
Here are typical SLO targets you should be validating:
| Metric | SLO Target | How to Validate |
|---|---|---|
| Availability | 99.9% (8.76 min/month) | Sustained load test at 2x peak |
| p50 Latency | < 100ms | Baseline load test at expected traffic |
| p95 Latency | < 300ms | Load test with realistic distribution |
| p99 Latency | < 500ms | Spike test at 5x normal traffic |
| Error Rate | < 0.1% | Endurance test over 1+ hours |
| Throughput | > 10,000 RPS | Sustained load test at peak |
Skipping these checks before a major release? That’s just guessing and hoping for the best.
Load Testing Tools Comparison
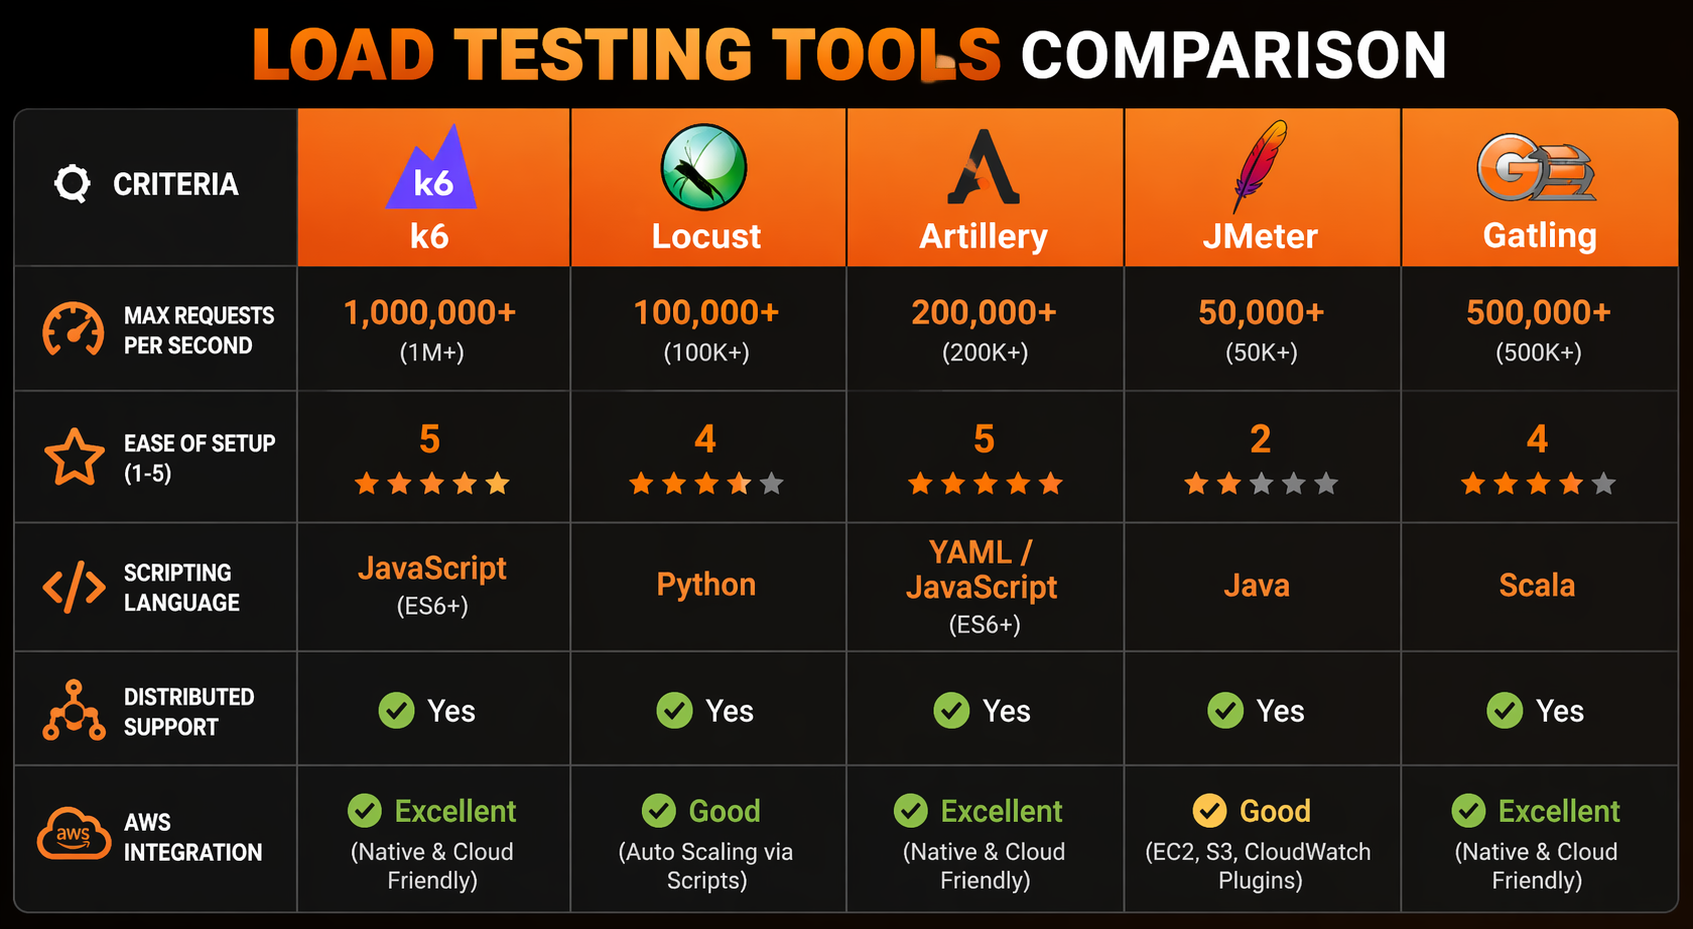
The tool landscape has settled into some clear winners. Let’s break down where things stand in 2026:
| Feature | k6 | Locust | Artillery | JMeter | Gatling |
|---|---|---|---|---|---|
| Language | JavaScript (ES6) | Python | YAML/JavaScript | Java/Groovy | Scala/Java |
| Protocol Support | HTTP, WebSocket, gRPC, GraphQL | HTTP, WebSocket, custom | HTTP, WebSocket, Socket.io | HTTP, JDBC, JMS, SOAP | HTTP, WebSocket, JMS |
| Distributed Mode | k6 Operator (K8s) | Built-in master-worker | Artillery Cloud / Lambda | Built-in remote servers | Enterprise only |
| Scripting Flexibility | High | Very High | Medium | Medium (UI + code) | High |
| Resource Efficiency | Excellent (Go runtime) | Good | Good | Poor (JVM overhead) | Good |
| Real-time Dashboard | Built-in + CloudWatch | Built-in web UI | Cloud dashboard | HTML report (post-run) | HTML report (post-run) |
| CI/CD Integration | Excellent | Good | Excellent | Moderate | Good |
| AWS Integration | k6 Cloud, CloudWatch | Custom | Lambda, Fargate | Custom | Custom |
| Open Source | Yes (AGPL) | Yes (MIT) | Yes (MPL) | Yes (Apache) | Partial |
| Learning Curve | Low | Low-Medium | Low | High | Medium-High |
| Cost to Scale | Low (Go binary) | Low-Medium | Medium | High (JVM memory) | Medium |
We’re zeroing in on k6 and Locust in this guide for a reason – between them, they cover the two scenarios you’ll actually run into. k6 is our pick for teams that want something fast, scriptable, and tightly integrated with Kubernetes. Locust is the answer for Python shops that need full flexibility to model complex user behavior without fighting a framework.
Architecture Options on AWS
You’ve basically got four ways to run distributed load tests on AWS, and none of them are perfect. Let’s walk through the tradeoffs.
Single EC2 Instance: Works fine if you’re staying under 10,000 virtual users. Spin up a c6i.4xlarge (or similar), point it at your target, and go. Dead simple to set up – but you’ll smack into CPU and network ceilings before long. At that point, the load generator itself becomes the bottleneck, which kind of defeats the purpose.
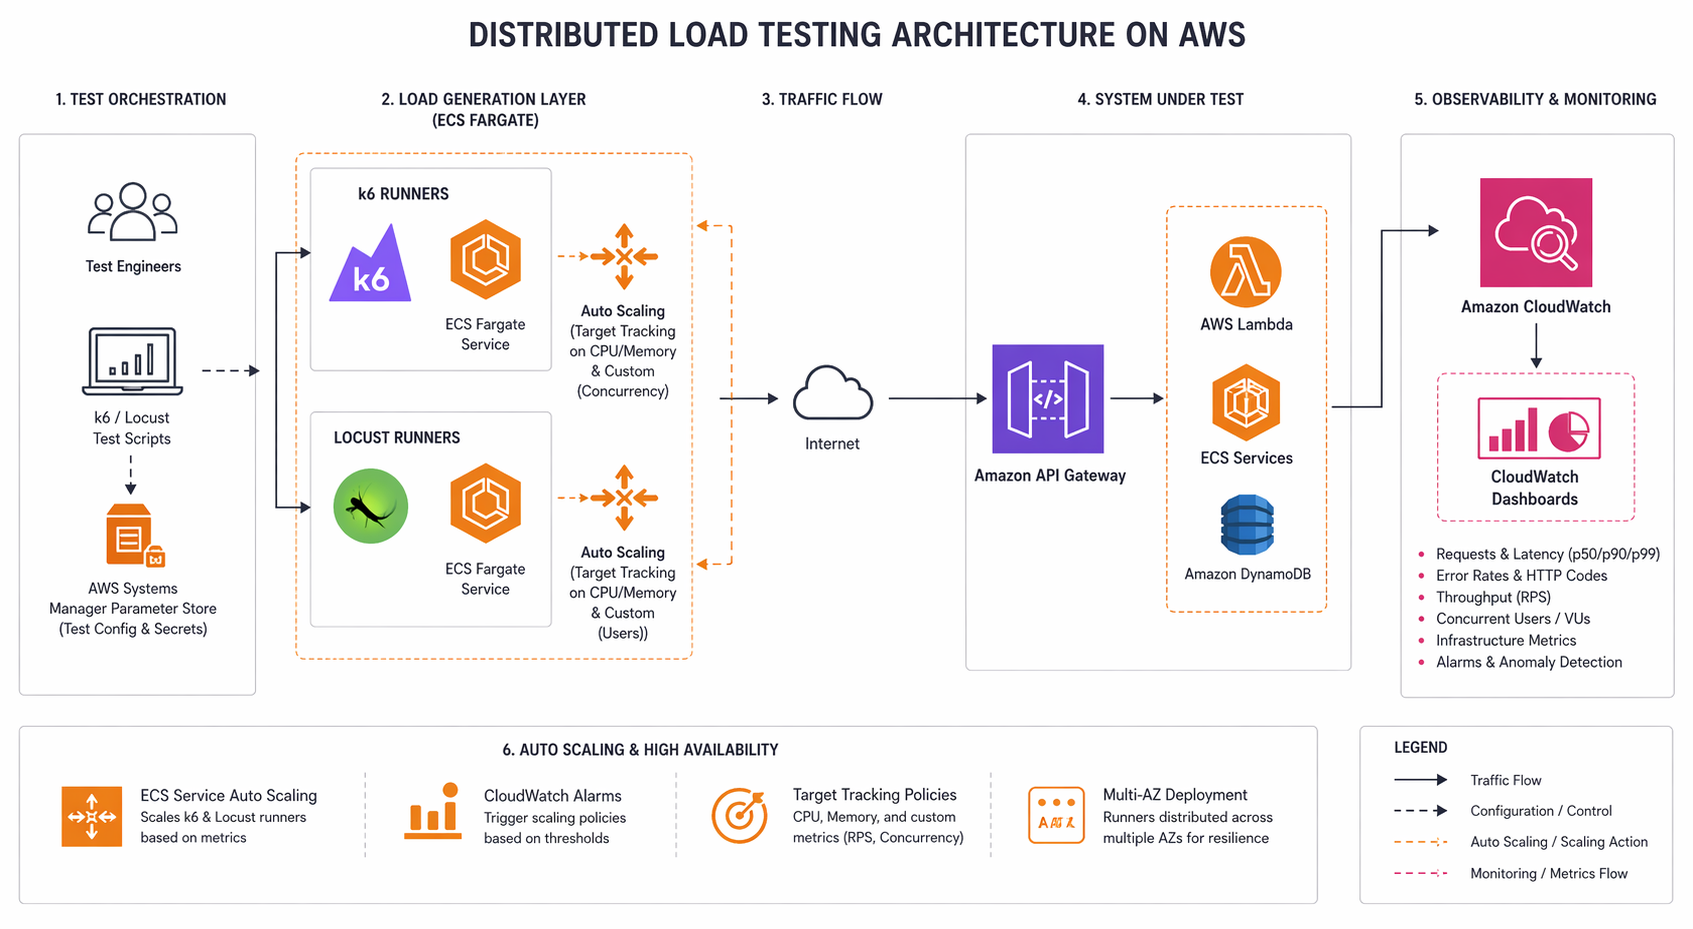
Distributed on ECS Fargate: This is where things get interesting. You spin up multiple Fargate tasks, each one running its own load generator, with a coordinator pulling results together. For most teams, this hits the sweet spot. No servers to babysit, horizontal scaling out of the box, and you only pay while tests are actually running. Hard to beat for scheduled or CI-triggered runs.
Distributed on EKS: If you’re already running EKS, the k6 Operator (or a custom Helm chart) turns load tests into Kubernetes jobs that manage themselves. The operator takes care of distributing the work, collecting results, and cleaning up afterward. Toss in Prometheus and Grafana, and you’ve got real-time monitoring baked right in.
Lambda-based: Lightweight load tests from Lambda functions – handy for API endpoint checks and smoke tests. The catch? Lambda’s 15-minute timeout and 6 GB memory ceiling keep a lid on what you can do. Don’t plan on sustained high-throughput work here, but for automated API contract validation, it’s surprisingly effective.
Here is a cost comparison for a typical test scenario (50,000 virtual users, 30-minute test):
| Architecture | Compute Cost (per test) | Setup Complexity | Max Concurrent Users | Cold Start |
|---|---|---|---|---|
| Single EC2 (c6i.4xlarge) | ~$1.20 | Low | ~15,000 | None |
| ECS Fargate (10 tasks) | ~$2.50 | Medium | 50,000+ | ~30 seconds |
| EKS (k6 Operator) | ~$2.00 | High | 100,000+ | None (if cluster warm) |
| Lambda (100 functions) | ~$0.80 | Medium | ~20,000 | ~5 seconds |
We’re spending most of this guide on the Fargate and EKS approaches because, frankly, they offer the best bang for your buck when it comes to production-grade load testing.
k6 Deep Dive
k6 has become our go-to recommendation for AWS performance testing, and it’s not hard to see why. Grafana Labs builds it, the Go runtime sips CPU and memory, and the JavaScript test scripts are readable enough that even your QA team can pick them up without much hand-holding.
Writing Your First k6 Test
Think of a k6 test script as a recipe with three ingredients: stages (how you ramp up and down), thresholds (what counts as passing or failing), and scenarios (what the virtual users actually do).
import http from 'k6/http';
import { check, sleep } from 'k6';

export const options = {
  stages: [
    { duration: '2m', target: 100 },   // Ramp up to 100 users
    { duration: '5m', target: 100 },   // Stay at 100 users
    { duration: '2m', target: 500 },   // Spike to 500 users
    { duration: '5m', target: 500 },   // Stay at 500 users
    { duration: '3m', target: 0 },     // Ramp down
  ],
  thresholds: {
    http_req_duration: ['p(95)<300', 'p(99)<500'],
    http_req_failed: ['rate<0.01'],
    checks: ['rate>0.99'],
  },
};

const BASE_URL = 'https://api.example.com';

export default function () {
  // Simulate a realistic user browsing session
  const loginRes = http.post(`${BASE_URL}/auth/login`, JSON.stringify({
    email: `user${__VU}@test.com`,
    password: 'TestPassword123!',
  }), {
    headers: { 'Content-Type': 'application/json' },
  });

  check(loginRes, {
    'login status is 200': (r) => r.status === 200,
    'has auth token': (r) => JSON.parse(r.body).token !== undefined,
  });

  const token = loginRes.json('token');

  // Browse product catalog
  const productsRes = http.get(`${BASE_URL}/products?page=1&limit=20`, {
    headers: { Authorization: `Bearer ${token}` },
  });

  check(productsRes, {
    'products status is 200': (r) => r.status === 200,
    'products returned': (r) => JSON.parse(r.body).items.length > 0,
  });

  sleep(Math.random() * 3 + 1); // Think time: 1-4 seconds
}
Everything important lives in the options block. The stages array lays out your ramp pattern, while thresholds sets the pass/fail line. Miss a threshold and k6 bails with a non-zero exit code – exactly what you want for CI/CD gates that should block deployments when performance slips.
Multiple Scenarios
Real apps don’t have just one type of user. Browsing gets way more traffic than checkout, for instance. k6 scenarios let you model that reality:
export const options = {
  scenarios: {
    browsing: {
      executor: 'constant-vus',
      vus: 300,
      duration: '10m',
      exec: 'browseProducts',
    },
    checkout: {
      executor: 'ramping-vus',
      startVUs: 0,
      stages: [
        { duration: '5m', target: 50 },
        { duration: '5m', target: 50 },
      ],
      exec: 'checkoutFlow',
    },
    search: {
      executor: 'ramping-arrival-rate',
      startRate: 10,
      timeUnit: '1s',
      stages: [
        { duration: '3m', target: 50 },
        { duration: '7m', target: 50 },
      ],
      preAllocatedVUs: 100,
      exec: 'searchProducts',
    },
  },
  thresholds: {
    http_req_duration: ['p(95)<300'],
    http_req_failed: ['rate<0.01'],
  },
};

export function browseProducts() {
  http.get('https://api.example.com/products');
  sleep(2);
}

export function checkoutFlow() {
  const cartRes = http.post('https://api.example.com/cart/add', JSON.stringify({
    productId: 1, quantity: 2,
  }), { headers: { 'Content-Type': 'application/json' } });

  http.post('https://api.example.com/checkout', '{}', {
    headers: { 'Content-Type': 'application/json' },
  });
  sleep(3);
}

export function searchProducts() {
  http.get('https://api.example.com/search?q=wireless+headphones');
  sleep(1);
}
Each scenario runs on its own with a dedicated executor type. Want to hold a steady user count? That’s constant-vus. Need to ramp up and down? Grab ramping-vus. If throughput (requests per second) matters more than how many users are online, ramping-arrival-rate is your friend – it targets a specific request rate instead of a user count.
CloudWatch Integration
One of k6’s quieter strengths: it can push metrics straight to CloudWatch. That means you can line up load test traffic right next to your app’s CPU, memory, and latency numbers on a single dashboard.
import exec from 'k6/execution';

// Custom metrics pushed to CloudWatch
import { Trend, Rate, Counter } from 'k6/metrics';

const apiLatency = new Trend('api_latency_ms');
const errorRate = new Rate('api_errors');
const requestCount = new Counter('api_requests_total');

export default function () {
  const res = http.get('https://api.example.com/health');

  apiLatency.add(res.timings.duration);
  errorRate.add(res.status >= 400);
  requestCount.add(1);
}
To push these metrics to CloudWatch, use the k6 CloudWatch output extension or the StatsD output with CloudWatch Agent. With the StatsD approach, install CloudWatch Agent on your test runner instances:
{
  "metrics": {
    "metrics_collected": {
      "statsd": {
        "service_address": ":8125",
        "metrics_collection_interval": 10,
        "metrics_aggregation_interval": 60
      }
    }
  }
}
Then run k6 with the StatsD output:
k6 run --out statsd test.js
What this gets you is all k6 metrics flowing into CloudWatch, ready to be layered onto dashboards alongside your app’s real-time vitals. Once you start running distributed tests across multiple runners, being able to see the full picture – how load impacts system behavior – goes from nice-to-have to absolutely essential. If CloudWatch is already part of your observability stack, this plugs right in without any fuss.
Locust Deep Dive
Locust takes a completely different tack. Since it’s Python-based, your entire test suite is just… Python. No proprietary DSL to learn, no YAML files to wrestle with, no clunky GUI builder. You write classes and functions, and you can pull in any Python library you need.
Writing a Locust Test
from locust import HttpUser, task, between, events
import json
import random

class ECommerceUser(HttpUser):
    wait_time = between(1, 4)
    host = "https://api.example.com"

    def on_start(self):
        """Called when each simulated user starts."""
        response = self.client.post("/auth/login", json={
            "email": f"loadtest.user.{self.id}@test.com",
            "password": "TestPassword123!"
        })
        if response.status_code == 200:
            self.token = response.json()["token"]
        else:
            self.token = None

    @task(5)
    def browse_products(self):
        """Browse product listing - highest frequency."""
        headers = {"Authorization": f"Bearer {self.token}"} if self.token else {}
        page = random.randint(1, 10)
        with self.client.get(
            f"/products?page={page}&limit=20",
            headers=headers,
            catch_response=True
        ) as response:
            if response.status_code == 200:
                data = response.json()
                if len(data.get("items", [])) == 0:
                    response.failure("No products returned")
                else:
                    response.success()
            else:
                response.failure(f"Unexpected status: {response.status_code}")

    @task(3)
    def search_products(self):
        """Search for products."""
        headers = {"Authorization": f"Bearer {self.token}"} if self.token else {}
        queries = ["wireless headphones", "laptop stand", "usb cable", "monitor"]
        query = random.choice(queries)
        self.client.get(f"/search?q={query}", headers=headers, name="/search")

    @task(1)
    def view_product_detail(self):
        """View a single product detail page."""
        headers = {"Authorization": f"Bearer {self.token}"} if self.token else {}
        product_id = random.randint(1, 1000)
        self.client.get(f"/products/{product_id}", headers=headers)

    @task(1)
    def add_to_cart_and_checkout(self):
        """Full checkout flow - lowest frequency."""
        headers = {
            "Authorization": f"Bearer {self.token}",
            "Content-Type": "application/json"
        } if self.token else {"Content-Type": "application/json"}

        # Add to cart
        self.client.post("/cart/add", json={
            "productId": random.randint(1, 100),
            "quantity": random.randint(1, 3)
        }, headers=headers)

        # Checkout
        self.client.post("/checkout", json={}, headers=headers)
Notice the @task decorator – that’s how you control the relative weight of each operation. Slapping @task(5) on browse products means it fires five times more often than checkout. The wait_time between tasks simulates the pauses real users take, and without it, your test results will be misleading.
Distributed Mode with Master-Worker
Here’s where Locust really shines: distributed testing comes baked in. Spin up one master process and as many workers as you need. The master handles traffic distribution and pulls all the results together.
# On the master node
locust -f locustfile.py --master --host=https://api.example.com

# On each worker node
locust -f locustfile.py --worker --master-host=10.0.1.50
Fire up the master and you get a web UI on port 8089 where you can kick off tests, tweak user counts on the fly, and watch the numbers roll in live. For exploratory testing sessions where you want to play with traffic levels interactively, this is honestly one of Locust’s killer features.
Custom Event Listeners for CloudWatch
Locust’s event system makes it straightforward to ship metrics wherever you want:
from locust import HttpUser, task, between, events
import boto3
import time

cloudwatch = boto3.client("cloudwatch", region_name="us-east-1")

@events.request.add_listener
def on_request(request_type, name, response_time, response_length, exception, **kwargs):
    """Push every request metric to CloudWatch."""
    cloudwatch.put_metric_data(
        Namespace="LoadTest/Locust",
        MetricData=[
            {
                "MetricName": "ResponseTime",
                "Value": response_time,
                "Unit": "Milliseconds",
                "Dimensions": [
                    {"Name": "Endpoint", "Value": name},
                    {"Name": "Method", "Value": request_type},
                ],
            },
            {
                "MetricName": "RequestCount",
                "Value": 1,
                "Unit": "Count",
                "Dimensions": [
                    {"Name": "Endpoint", "Value": name},
                ],
            },
        ],
    )

    if exception:
        cloudwatch.put_metric_data(
            Namespace="LoadTest/Locust",
            MetricData=[{
                "MetricName": "Errors",
                "Value": 1,
                "Unit": "Count",
                "Dimensions": [{"Name": "Endpoint", "Value": name}],
            }],
        )
Now you’ve got per-endpoint latency and error counts sitting in CloudWatch, right next to your ALB target response time and EC2 CPU numbers. When something’s slow and you need to track down the bottleneck, having everything in one dashboard is the difference between a ten-minute fix and a two-hour fire drill.
Distributed Load Testing on ECS Fargate
If we had to pick one architecture to recommend to most teams, this would be it. Fargate hands you containerized test runners with zero server management, and scaling to tens of thousands of virtual users is as simple as adding more tasks.
Step 1: Containerize Your Load Test
For k6:
FROM grafana/k6:0.54.0

COPY tests/ /home/k6/tests/
WORKDIR /home/k6

ENTRYPOINT ["k6", "run"]
For Locust:
FROM python:3.12-slim

RUN pip install locust==2.31.0 boto3

COPY locustfile.py /opt/locust/
WORKDIR /opt/locust

EXPOSE 8089 5557 5558

ENTRYPOINT ["locust"]
Step 2: CloudFormation Template
Here is a complete CloudFormation template that sets up an ECS cluster, task definitions, and a VPC for distributed load testing:
AWSTemplateFormatVersion: '2010-09-09'
Description: 'Distributed Load Testing on ECS Fargate'

Parameters:
  VpcId:
    Type: AWS::EC2::VPC::Id
    Description: VPC for load test runners
  SubnetIds:
    Type: List<AWS::EC2::Subnet::Id>
    Description: Subnets for Fargate tasks
  TargetUrl:
    Type: String
    Description: URL of the system under test
  TaskCount:
    Type: Number
    Default: 5
    Description: Number of Fargate tasks (load generators)
  VirtualUsers:
    Type: Number
    Default: 5000
    Description: Total virtual users across all tasks

Resources:
  LoadTestCluster:
    Type: AWS::ECS::Cluster
    Properties:
      ClusterName: load-test-cluster
      CapacityProviders:
        - FARGATE
      DefaultCapacityProviderStrategy:
        - CapacityProvider: FARGATE
          Weight: 1

  LoadTestLogGroup:
    Type: AWS::Logs::LogGroup
    Properties:
      LogGroupName: /ecs/load-test
      RetentionInDays: 7

  K6TaskRole:
    Type: AWS::IAM::Role
    Properties:
      AssumeRolePolicyDocument:
        Version: '2012-10-17'
        Statement:
          - Effect: Allow
            Principal:
              Service: ecs-tasks.amazonaws.com
            Action: 'sts:AssumeRole'
      ManagedPolicyArns:
        - arn:aws:iam::aws:policy/CloudWatchFullAccess
      Policies:
        - PolicyName: LoadTestPolicy
          PolicyDocument:
            Version: '2012-10-17'
            Statement:
              - Effect: Allow
                Action:
                  - 'cloudwatch:PutMetricData'
                  - 'logs:CreateLogStream'
                  - 'logs:PutLogEvents'
                Resource: '*'

  K6TaskDefinition:
    Type: AWS::ECS::TaskDefinition
    Properties:
      Family: k6-load-test
      NetworkMode: awsvpc
      RequiresCompatibilities:
        - FARGATE
      Cpu: '2048'
      Memory: '4096'
      ExecutionRoleArn: !GetAtt K6TaskRole.Arn
      TaskRoleArn: !GetAtt K6TaskRole.Arn
      ContainerDefinitions:
        - Name: k6-runner
          Image: '123456789012.dkr.ecr.us-east-1.amazonaws.com/k6-load-test:latest'
          Essential: true
          Command:
            - 'run'
            - '--out'
            - 'statsd'
            - '--vus'
            - !Ref VirtualUsersPerTask
            - '/home/k6/tests/api-load-test.js'
          LogConfiguration:
            LogDriver: awslogs
            Options:
              awslogs-group: !Ref LoadTestLogGroup
              awslogs-stream-prefix: k6
              awslogs-region: !Ref AWS::Region

  LoadTestService:
    Type: AWS::ECS::Service
    Properties:
      Cluster: !Ref LoadTestCluster
      TaskDefinition: !Ref K6TaskDefinition
      DesiredCount: !Ref TaskCount
      LaunchType: FARGATE
      NetworkConfiguration:
        AwsvpcConfiguration:
          Subnets: !Ref SubnetIds
          SecurityGroups:
            - !Ref LoadTestSG
          AssignPublicIp: ENABLED

  LoadTestSG:
    Type: AWS::EC2::SecurityGroup
    Properties:
      GroupDescription: Load test runner security group
      VpcId: !Ref VpcId
      SecurityGroupEgress:
        - IpProtocol: -1
          CidrIp: 0.0.0.0/0
Step 3: Run the Test
# Deploy the stack
aws cloudformation deploy \
  --template-file load-test-fargate.yaml \
  --stack-name load-test \
  --parameter-overrides \
    VpcId=vpc-0abc123def456 \
    SubnetIds=subnet-111,subnet-222 \
    TargetUrl=https://api.example.com \
    TaskCount=10 \
    VirtualUsers=50000 \
  --capabilities CAPABILITY_IAM

# Check running tasks
aws ecs describe-services \
  --cluster load-test-cluster \
  --services load-test-service \
  --query 'services[0].runningCount'

# Tail logs
aws logs tail /ecs/load-test --follow

# Clean up when done
aws cloudformation delete-stack --stack-name load-test
Here’s the math for a 30-minute test with 10 Fargate tasks (2 vCPU, 4 GB each): roughly $2.50. Run that weekly and you’re looking at about $10/month for your entire load testing infrastructure. That’s pocket change compared to what a single production outage will cost you.
Distributed Load Testing on EKS with k6 Operator
Already running EKS with Karpenter handling your autoscaling? The k6 Operator is probably the smoothest path to distributed load testing. It registers a Kubernetes Custom Resource Definition (CRD) for your test runs and manages the whole lifecycle – spin up, execute, tear down – without you lifting a finger.
Step 1: Install the k6 Operator
# Add the Grafana Helm repo
helm repo add grafana https://grafana.github.io/helm-charts
helm repo update

# Install the operator
helm install k6-operator grafana/k6-operator \
  --namespace k6-system \
  --create-namespace
Step 2: Define a TestRun Custom Resource
apiVersion: k6.io/v1alpha1
kind: TestRun
metadata:
  name: api-load-test
  namespace: k6-tests
spec:
  parallelism: 10
  script:
    configMap:
      name: k6-test-script
      file: api-load-test.js
  runner:
    env:
      - name: BASE_URL
        value: "https://api.example.com"
    resources:
      requests:
        cpu: "1"
        memory: "1Gi"
      limits:
        cpu: "2"
        memory: "2Gi"
    envFrom:
      - secretRef:
          name: test-credentials
  starter:
    resources:
      requests:
        cpu: "200m"
        memory: "256Mi"
  arguments: --out statsd --tag testid=api-load-2026-04-22
  thresholds:
    http_req_duration:
      - p(95)<300
    http_req_failed:
      - rate<0.01
Step 3: Create the ConfigMap with Your Test Script
kubectl create configmap k6-test-script \
  --from-file=api-load-test.js=tests/api-load-test.js \
  -n k6-tests
Step 4: Run the Test
kubectl apply -f testrun.yaml -n k6-tests

# Watch the test progress
kubectl get testrun -n k6-tests -w

# View runner pod logs
kubectl logs -l k6-test=api-load-test -n k6-tests --tail=100

# The operator automatically cleans up pods when the test completes
Behind the scenes, the k6 Operator divides your virtual users evenly across the runner pods. So with parallelism: 10 and a 50,000 VU test, each runner takes on 5,000 users. The starter pod kicks things off and pulls the results together at the end.
One thing to watch if you’re running EC2 Auto Scaling Groups under EKS: Karpenter (or the Cluster Autoscaler) will spin up extra nodes when those k6 runner pods land. Just double-check that your node group or provisioner’s capacity limits are high enough to absorb the burst. Running out of room mid-test is a frustrating way to discover your ceiling.
Terraform for the EKS Setup
resource "kubernetes_namespace" "k6_tests" {
  metadata {
    name = "k6-tests"
  }
}

resource "helm_release" "k6_operator" {
  name       = "k6-operator"
  repository = "https://grafana.github.io/helm-charts"
  chart      = "k6-operator"
  namespace  = "k6-system"
  create_namespace = true

  set {
    name  = "controllerManager.manager.image.tag"
    value = "latest"
  }
}

resource "kubernetes_config_map" "k6_script" {
  metadata {
    name      = "k6-test-script"
    namespace = kubernetes_namespace.k6_tests.metadata[0].name
  }

  data = {
    "api-load-test.js" = file("${path.module}/tests/api-load-test.js")
  }
}
Load Testing Serverless (Lambda)
Serverless backends throw a curveball at load testing. You can’t just blast 50,000 concurrent requests at Lambda from a single load generator – the Lambda invocation APIs have their own rate limits that’ll throttle you first. The workaround? Use Lambda to test Lambda.
Artillery Lambda
Artillery ships a Lambda integration that deploys your load test straight to Lambda functions, with Step Functions orchestrating the whole thing:
# artillery-config.yml
config:
  target: "https://api.example.com"
  phases:
    - duration: 300
      arrivalRate: 100
      rampTo: 500
      name: Ramp up
    - duration: 600
      arrivalRate: 500
      name: Sustained load

scenarios:
  - name: "API Health Check"
    flow:
      - get:
          url: "/health"
      - think: 1
      - get:
          url: "/products?page=1"
Deploy with the Artillery CLI:
artillery run --platform aws \
  --region us-east-1 \
  --count 20 \
  artillery-config.yml
That --count 20 flag fires up 20 Lambda functions that coordinate through SQS. Each one chugs along for up to 14 minutes (Lambda’s hard limit, minus a safety buffer), and the aggregated results stream right back to your terminal.
Custom Lambda Load Generator
For more control, write your own Lambda-based load generator:
import json
import time
import urllib3
import os
import boto3

http = urllib3.PoolManager()
TARGET_URL = os.environ["TARGET_URL"]
REQUESTS_PER_INVOCATION = int(os.environ.get("REQUESTS_PER_INVOCATION", "100"))
RESULTS_QUEUE = os.environ.get("RESULTS_QUEUE")

sqs = boto3.client("sqs")

def lambda_handler(event, context):
    results = {
        "total_requests": 0,
        "successful": 0,
        "failed": 0,
        "latencies": [],
    }

    for i in range(REQUESTS_PER_INVOCATION):
        start = time.time()
        try:
            response = http.request(
                "GET",
                f"{TARGET_URL}/products?page=1&limit=20"
            )
            latency = (time.time() - start) * 1000
            results["latencies"].append(latency)
            results["total_requests"] += 1

            if 200 <= response.status < 400:
                results["successful"] += 1
            else:
                results["failed"] += 1
        except Exception as e:
            results["total_requests"] += 1
            results["failed"] += 1

    # Calculate summary stats
    latencies = results["latencies"]
    latencies.sort()

    summary = {
        "invocation_id": context.aws_request_id,
        "total_requests": results["total_requests"],
        "successful": results["successful"],
        "failed": results["failed"],
        "p50": latencies[len(latencies) // 2] if latencies else 0,
        "p95": latencies[int(len(latencies) * 0.95)] if latencies else 0,
        "p99": latencies[int(len(latencies) * 0.99)] if latencies else 0,
    }

    # Push to SQS for aggregation
    if RESULTS_QUEUE:
        sqs.send_message(
            QueueUrl=RESULTS_QUEUE,
            MessageBody=json.dumps(summary),
        )

    return summary
Use Step Functions to fan out 50-100 concurrent Lambda invocations:
{
  "Comment": "Distributed load test via Lambda",
  "StartAt": "FanOut",
  "States": {
    "FanOut": {
      "Type": "Map",
      "MaxConcurrency": 100,
      "Iterator": {
        "StartAt": "RunLoadTest",
        "States": {
          "RunLoadTest": {
            "Type": "Task",
            "Resource": "arn:aws:lambda:us-east-1:123456789012:function:load-generator",
            "End": true
          }
        }
      },
      "Next": "AggregateResults"
    },
    "AggregateResults": {
      "Type": "Task",
      "Resource": "arn:aws:lambda:us-east-1:123456789012:function:aggregate-results",
      "End": true
    }
  }
}
This pattern works nicely if you’re hammering on AWS Lambda managed instances or API Gateway endpoints backed by Lambda. Since Lambda bills by the millisecond, most tests stay within the free tier or barely crack $1.
Just keep your expectations in check on throughput. A single Lambda function can push somewhere between 100 and 500 requests per second, depending on how fast the target responds. With 100 functions running in parallel, you’re topping out around 50,000 RPS. Need more than that? Shift over to ECS Fargate or EKS.
Testing Against Auto Scaling
Here’s the uncomfortable truth about auto scaling: you don’t know if it actually works until you load test it. We’ve watched teams set up target tracking on CPU, feeling confident, only to discover – mid-test – that response times tanked for three solid minutes before new instances joined the party. Three minutes might not sound like much, but for user-facing apps, it’s an eternity.
Pre-Warming Strategy
The problem is that scaling isn’t instant. Booting new instances takes real time. With EC2 Auto Scaling Groups, you’re looking at 2-5 minutes from trigger to traffic-ready. ECS Fargate cuts that to 30-60 seconds. App Runner gets you closest at 20-40 seconds.
The fix is pre-warming: send a gentle stream of traffic before your peak test starts, so scaling kicks in early and capacity is ready when you need it:
// k6 pre-warming scenario
export const options = {
  scenarios: {
    // Phase 1: Warm up the system, trigger auto scaling
    warmup: {
      executor: 'ramping-vus',
      startVUs: 0,
      stages: [
        { duration: '5m', target: 200 },   // Gentle ramp
      ],
      gracefulStop: '0s',
    },
    // Phase 2: Hit peak load (instances should already be warm)
    peak: {
      executor: 'ramping-vus',
      startVUs: 0,
      stages: [
        { duration: '1m', target: 2000 },  // Fast ramp to peak
        { duration: '10m', target: 2000 },  // Sustain peak
      ],
      startTime: '5m',  // Start after warmup
      gracefulStop: '30s',
    },
  },
};
Validating Target Tracking
Set up a CloudWatch alarm that monitors your application’s p99 latency during the test:
aws cloudwatch put-metric-alarm \
  --alarm-name load-test-p99-latency \
  --alarm-description "p99 latency exceeded during load test" \
  --metric-name TargetResponseTime \
  --namespace AWS/ApplicationELB \
  --statistic p99 \
  --period 60 \
  --threshold 0.5 \
  --comparison-operator GreaterThanThreshold \
  --evaluation-periods 3 \
  --dimensions Name=LoadBalancer,Value=app/my-alb/50dc6c495c0c918f
Run your load test and watch whether:
- Auto Scaling triggers before latency exceeds your SLO
- New instances come online fast enough to absorb the load
- The system stabilizes at the new capacity level
- Scale-in happens gracefully after load decreases
Step Scaling Validation
Step scaling policies respond faster than target tracking because they add capacity in discrete steps based on alarm breaching. Test this with a spike scenario:
export const options = {
  stages: [
    { duration: '2m', target: 100 },    // Normal load
    { duration: '10s', target: 5000 },  // Spike!
    { duration: '10m', target: 5000 },  // Hold at spike
    { duration: '5m', target: 100 },    // Return to normal
    { duration: '5m', target: 100 },    // Watch scale-in
  ],
};
During the spike, monitor your Auto Scaling group activity:
aws autoscaling describe-scaling-activities \
  --auto-scaling-group-name my-asg \
  --max-records 10
You want to see scale-out activities triggered within 60 seconds of the spike and new instances in service within 3-5 minutes. If it takes longer, you need to adjust your step scaling thresholds or pre-warm.
Load Testing API Gateway
One gotcha with API Gateway: it has built-in throttling that can quietly swallow your test traffic before it ever reaches the backend. If you’re load testing through API Gateway, you need to account for those rate limits – otherwise you’re measuring Gateway throttling, not backend performance.
Default Throttling Limits
| API Gateway Type | Default Rate Limit | Default Burst Limit |
|---|---|---|
| REST API (regional) | 10,000 RPS | 5,000 |
| REST API (edge-optimized) | 10,000 RPS per region | Varies |
| HTTP API | 10,000 RPS (account default) | Configurable |
| WebSocket | 10,000 new connections/sec | Varies |
Keep in mind these limits are per-account, per-region. Running multiple APIs in the same account? They’re all drawing from the same pool.
Configuring Throttling for Load Tests
Before hammering API Gateway at high throughput, submit a quota increase request through AWS Support. Once that’s approved, bump up the stage-level throttling:
aws apigateway update-stage \
  --rest-api-id abc123def4 \
  --stage-name prod \
  --patch-operations op=replace,path=/throttling/rateLimit,value=50000 op=replace,path=/throttling/burstLimit,value=25000
Testing with WAF Integration
If WAF sits in front of your API Gateway (and for production, it really should), your test traffic might trip the rate-based rules. Two options: add the test runner IPs to an allowlist, or flip the rate-based rule into Count mode while testing:
# Temporarily set rate-based rule to count mode
aws wafv2 update-web-acl \
  --scope REGIONAL \
  --id abc123-def456 \
  --name api-waf \
  --default-action Allow={} \
  --rules '[{
    "Name": "RateLimitAllowLoadTest",
    "Priority": 0,
    "Statement": {
      "IPSetReferenceStatement": {
        "ARN": "arn:aws:wafv2:us-east-1:123456789012:ipset/load-test-runners/abc123"
      }
    },
    "Action": { "Allow": {} },
    "VisibilityConfig": {
      "SampledRequestsEnabled": true,
      "CloudWatchMetricsEnabled": true,
      "MetricName": "AllowLoadTest"
    }
  }]' \
  --visibility-config SampledRequestsEnabled=true,CloudWatchMetricsEnabled=true,MetricName=api-waf
This way your test traffic sails through WAF unmolested, while still getting logged for later review.
Database Load Testing
Here’s something that catches people off guard: application-level load testing can actually hide database bottlenecks. Why? Because app servers scale horizontally, but databases usually don’t. Hitting your database directly under load is the only way to find the real ceiling.
Aurora MySQL Performance
// k6 test that stresses database through API
// This test hits endpoints that are read-heavy vs write-heavy

export const options = {
  scenarios: {
    readHeavy: {
      executor: 'constant-vus',
      vus: 500,
      duration: '10m',
      exec: 'readOperations',
    },
    writeHeavy: {
      executor: 'constant-vus',
      vus: 50,
      duration: '10m',
      exec: 'writeOperations',
    },
  },
};

export function readOperations() {
  // Endpoint that triggers SELECT queries
  http.get('https://api.example.com/products?category=electronics&sort=price&page=1');
  http.get('https://api.example.com/products/123/reviews');
  sleep(1);
}

export function writeOperations() {
  // Endpoint that triggers INSERT/UPDATE queries
  http.post('https://api.example.com/orders', JSON.stringify({
    items: [{ productId: 1, qty: 2 }],
    shippingAddress: '123 Test St',
  }), { headers: { 'Content-Type': 'application/json' } });
  sleep(2);
}
Database Performance Benchmarks
These are the baseline numbers we’ve measured for common Aurora configurations under sustained load:
| Configuration | Max Connections | Read Throughput | Write Throughput | p99 Latency |
|---|---|---|---|---|
| Aurora Serverless v2 (min: 2, max: 8 ACU) | ~1,600 | ~8,000 QPS | ~2,000 QPS | < 20ms |
| Aurora Serverless v2 (min: 4, max: 32 ACU) | ~6,400 | ~30,000 QPS | ~8,000 QPS | < 15ms |
| Aurora Provisioned (db.r6g.2xlarge) | ~2,000 | ~15,000 QPS | ~4,000 QPS | < 10ms |
| Aurora Provisioned (db.r6g.8xlarge) | ~8,000 | ~60,000 QPS | ~15,000 QPS | < 8ms |
| Aurora I/O-Optimized (db.r6g.4xlarge) | ~4,000 | ~30,000 QPS | ~8,000 QPS | < 5ms |
DynamoDB Load Testing
Switching gears to DynamoDB – here the name of the game is consumed read and write capacity units. k6 handles this well through a Lambda proxy or API Gateway layer:
# Locust test for DynamoDB-backed API
from locust import HttpUser, task, between
import uuid

class DynamoDBBackedUser(HttpUser):
    wait_time = between(0.5, 2)

    @task(10)
    def get_item(self):
        """Read-heavy: DynamoDB GetItem via API"""
        item_id = str(uuid.uuid4())
        self.client.get(f"/api/items/{item_id}", name="/api/items/[id]")

    @task(3)
    def query_items(self):
        """Query with filter: DynamoDB Query via API"""
        self.client.get("/api/items?category=electronics&limit=50", name="/api/items?query")

    @task(1)
    def put_item(self):
        """Write: DynamoDB PutItem via API"""
        self.client.post("/api/items", json={
            "id": str(uuid.uuid4()),
            "category": "electronics",
            "name": "Test Product",
            "price": 29.99,
        })
Monitor DynamoDB consumed capacity during the test:
aws cloudwatch get-metric-statistics \
  --namespace AWS/DynamoDB \
  --metric-name ConsumedReadCapacityUnits \
  --dimensions Name=TableName,Value=Products \
  --statistics Sum \
  --period 60 \
  --start-time $(date -u -d '10 minutes ago' +%Y-%m-%dT%H:%M:%S) \
  --end-time $(date -u +%Y-%m-%dT%H:%M:%S)
If consumed capacity keeps bumping up against your provisioned limit (or on-demand throttling starts firing), congratulations – your test just found the database bottleneck.
CI/CD Integration
Load tests belong in your CI/CD pipeline, running on autopilot – not sitting on a shelf until someone remembers to kick them off manually. Let’s look at how to wire that up.
GitHub Actions
name: Load Test
on:
  workflow_dispatch:
    inputs:
      environment:
        description: 'Target environment'
        required: true
        default: 'staging'
        type: choice
        options:
          - staging
          - production
      vus:
        description: 'Virtual users'
        required: true
        default: '500'
      duration:
        description: 'Test duration'
        required: true
        default: '5m'

jobs:
  load-test:
    runs-on: ubuntu-latest
    steps:
      - uses: actions/checkout@v4

      - name: Install k6
        run: |
          curl https://github.com/grafana/k6/releases/download/v0.54.0/k6-v0.54.0-linux-amd64.tar.gz -L | tar xvz
          sudo mv k6-*/k6 /usr/local/bin/

      - name: Run k6 load test
        env:
          TARGET_URL: $
          K6_CLOUD_TOKEN: $
        run: |
          k6 run \
            --vus $ \
            --duration $ \
            --env TARGET_URL=$TARGET_URL \
            --out json=results.json \
            tests/k6/api-load-test.js

      - name: Upload results
        if: always()
        uses: actions/upload-artifact@v4
        with:
          name: k6-results
          path: results.json

      - name: Check thresholds passed
        if: always()
        run: |
          # k6 exits with non-zero if thresholds fail
          # This step provides a clear failure message
          echo "Load test completed. Check results artifact for details."
GitLab CI
stages:
  - test
  - load-test
  - report

load-test-k6:
  stage: load-test
  image: grafana/k6:0.54.0
  variables:
    TARGET_URL: "https://staging-api.example.com"
  script:
    - k6 run
        --vus 1000
        --duration 10m
        --out json=results.json
        --threshold-fg
        tests/k6/api-load-test.js
  artifacts:
    paths:
      - results.json
    expire_in: 30 days
  when: manual
  tags:
    - docker

load-test-locust:
  stage: load-test
  image: python:3.12-slim
  before_script:
    - pip install locust==2.31.0
  script:
    - locust
        -f tests/locust/locustfile.py
        --host $TARGET_URL
        --users 500
        --spawn-rate 10
        --run-time 5m
        --headless
        --csv=results
        --html=report.html
  artifacts:
    paths:
      - results*.csv
      - report.html
    expire_in: 30 days
  when: manual
  tags:
    - docker
The important design choice here is when: manual for production load tests. You want a real person to sign off before hammering production, but staging tests? Those can fire automatically on every deploy.
Cost Analysis
Let’s talk money. Load testing infrastructure costs are refreshingly easy to pin down.
Per-Test Cost Estimates
| Architecture | Configuration | 30-Min Test | 1-Hour Test | Monthly (4x 30-min) |
|---|---|---|---|---|
| Single EC2 (c6i.xlarge) | On-Demand | $0.09 | $0.17 | $0.35 |
| Single EC2 (c6i.4xlarge) | On-Demand | $0.35 | $0.70 | $1.40 |
| ECS Fargate (5 tasks) | 1 vCPU, 2 GB each | $0.60 | $1.20 | $2.40 |
| ECS Fargate (10 tasks) | 2 vCPU, 4 GB each | $2.40 | $4.80 | $9.60 |
| ECS Fargate (20 tasks) | 2 vCPU, 4 GB each | $4.80 | $9.60 | $19.20 |
| EKS (k6 Operator, 10 pods) | 2 vCPU, 2 GB each | $2.00 | $4.00 | $8.00 |
| Lambda (100 invocations) | 1024 MB, 14 min each | $0.80 | N/A | $3.20 |
Spot Instance Pricing
If you’re running EKS-based load tests, grab spot instances for the worker nodes – that’ll shave 60-70% off the compute bill:
# Karpenter provisioner with spot instances for load testing
resource "kubectl_manifest" "k6_provisioner" {
  yaml_body = <<-YAML
    apiVersion: karpenter.sh/v1
    kind: NodePool
    metadata:
      name: k6-load-test
    spec:
      template:
        spec:
          requirements:
            - key: karpenter.k8s.aws/instance-category
              operator: In
              values: ["c"]
            - key: karpenter.k8s.aws/capacity-type
              operator: In
              values: ["spot"]
          nodeClassRef:
            name: default
      limits:
        cpu: 100
      disruption:
        consolidationPolicy: WhenEmpty
        consolidateAfter: 30s
  YAML
}
With spot pricing, that 10-pod EKS test drops from $2.00 down to roughly $0.70 per 30-minute run. Hard to argue with that.
Instance Type Selection
| Instance Type | vCPUs | Memory | Network | On-Demand/hr | Spot/hr | Best For |
|---|---|---|---|---|---|---|
| c6i.xlarge | 4 | 8 GB | Up to 12.5 Gbps | $0.17 | $0.05 | Small tests, CI |
| c6i.2xlarge | 8 | 16 GB | Up to 12.5 Gbps | $0.34 | $0.10 | Medium tests |
| c6i.4xlarge | 16 | 32 GB | 12.5 Gbps | $0.68 | $0.20 | Large distributed tests |
| c6i.8xlarge | 32 | 64 GB | 12.5 Gbps | $1.36 | $0.41 | High-throughput tests |
| c7i.4xlarge | 16 | 32 GB | Up to 12.5 Gbps | $0.76 | $0.23 | Graviton-based efficiency |
| m6i.2xlarge | 8 | 32 GB | Up to 12.5 Gbps | $0.38 | $0.11 | Mixed workloads |
Stick with compute-optimized instances (c6i, c7i) for load generation – the bottlenecks are CPU for building requests and network bandwidth for pushing them through. Memory almost never becomes an issue.
Best Practices
After running hundreds of load tests across dozens of systems, these are the patterns that actually deliver reliable, actionable results.
Ramp-Up Strategy
Whatever you do, don’t start a load test at maximum users right out of the gate. A flat-line start tells you that something broke, but not where the actual tipping point was. Ramp up instead:
// Good: Gradual ramp reveals the breaking point
export const options = {
  stages: [
    { duration: '5m', target: 500 },    // Ramp to 500
    { duration: '5m', target: 1000 },   // Ramp to 1000
    { duration: '5m', target: 2000 },   // Ramp to 2000
    { duration: '5m', target: 5000 },   // Ramp to 5000
    { duration: '10m', target: 5000 },  // Hold at peak
    { duration: '5m', target: 0 },      // Ramp down
  ],
};
A gradual ramp reveals the precise moment latency starts creeping up. Jump straight to 5,000 VUs and watch everything catch fire, and yeah, you know something broke – but you’ve got no idea where the actual ceiling was.
Think Time
Here’s the thing about real users – they don’t fire requests as fast as physically possible. They click, read, scroll, daydream, and then click again. Strip out think time and your load test produces traffic patterns that look nothing like reality, which means the results are essentially garbage.
# Locust think time
from locust import HttpUser, task, between

class RealisticUser(HttpUser):
    wait_time = between(2, 8)  # 2-8 seconds between actions

    @task
    def browse(self):
        self.client.get("/products")
The distribution matters more than you’d think. A normal distribution centered on your app’s actual inter-request time beats a fixed interval every time. Locust’s between() already bakes in some randomness, which is a solid start.
Realistic Scenarios
Mirror your actual traffic mix. If 80% of real traffic is reads and 20% is writes, your test better reflect that ratio:
// k6 scenario with realistic traffic distribution
export const options = {
  scenarios: {
    browsing: {    // 80% of traffic
      executor: 'constant-arrival-rate',
      rate: 800,
      timeUnit: '1s',
      duration: '10m',
      preAllocatedVUs: 2000,
      exec: 'browse',
    },
    purchasing: {  // 15% of traffic
      executor: 'constant-arrival-rate',
      rate: 150,
      timeUnit: '1s',
      duration: '10m',
      preAllocatedVUs: 500,
      exec: 'purchase',
    },
    admin: {       // 5% of traffic
      executor: 'constant-arrival-rate',
      rate: 50,
      timeUnit: '1s',
      duration: '10m',
      preAllocatedVUs: 100,
      exec: 'admin',
    },
  },
};
Test Data Management
Load tests are hungry for data, but here’s a tip: generate it beforehand, not on the fly. If your test spins up new users during the run, you’re mostly stress-testing your registration endpoint instead of the workload you actually care about:
// Pre-generate test data
import { SharedArray } from 'k6/data';

const users = new SharedArray('users', function () {
  return JSON.parse(open('./test-users.json')).users;
});

export default function () {
  const user = users[__VU % users.length];
  // Use pre-created user credentials
  const res = http.post(`${BASE_URL}/auth/login`, JSON.stringify({
    email: user.email,
    password: user.password,
  }));
}
For Locust, generate a CSV of test users and load it at startup:
import csv
import random

class ECommerceUser(HttpUser):
    def on_start(self):
        with open("test_users.csv") as f:
            reader = csv.DictReader(f)
            self.test_users = list(reader)
        user = random.choice(self.test_users)
        self.email = user["email"]
        self.password = user["password"]
Don’t Test from the Same Network
Running load generators and your app in the same VPC? Then you’re not measuring the real user experience. Real traffic battles through the internet, DNS lookups, TLS handshakes, maybe a CloudFront hop or two. Whenever possible, test from outside your VPC – or at least from a separate VPC that routes through an internet-facing path.
Isolate Test Environments
If you do test against production, pick a low-traffic window and give stakeholders a heads-up. Ideally though, keep a staging environment that mirrors your production setup. Save the destructive “break it till it snaps” tests for staging. Run validation tests (can we handle expected peak?) in production during maintenance windows.
Tool Selection Decision Matrix
At the end of the day, picking between k6 and Locust really comes down to who’s on your team and what you’re trying to do:
| Criteria | Choose k6 When… | Choose Locust When… |
|---|---|---|
| Team language | JavaScript/TypeScript | Python |
| Scale | Need >50,000 VUs | Need <30,000 VUs |
| Kubernetes | Already on EKS | Not running K8s |
| Real-time UI | CLI output is sufficient | Want interactive web dashboard |
| CI/CD | GitHub Actions / GitLab CI | Jenkins or custom pipelines |
| Test complexity | Protocol-level testing | Complex user simulations |
| Scripting needs | Standard HTTP/gRPC | Custom protocols, ML model calls |
| Ecosystem | Grafana/Prometheus stack | Custom Python libraries |
End-to-End Example: Complete Distributed Test Pipeline
Before shipping things off to AWS, here’s a Docker Compose setup that lets you kick the tires on the full distributed Locust stack right on your laptop:
version: '3.8'

services:
  locust-master:
    build:
      context: .
      dockerfile: Dockerfile.locust
    ports:
      - "8089:8089"
    command: >
      locust
      -f /opt/locust/locustfile.py
      --master
      --host=https://staging-api.example.com
      --expect-workers=3
    environment:
      - LOCUST_HOST=https://staging-api.example.com

  locust-worker-1:
    build:
      context: .
      dockerfile: Dockerfile.locust
    command: >
      locust
      -f /opt/locust/locustfile.py
      --worker
      --master-host=locust-master
    depends_on:
      - locust-master

  locust-worker-2:
    build:
      context: .
      dockerfile: Dockerfile.locust
    command: >
      locust
      -f /opt/locust/locustfile.py
      --worker
      --master-host=locust-master
    depends_on:
      - locust-master

  locust-worker-3:
    build:
      context: .
      dockerfile: Dockerfile.locust
    command: >
      locust
      -f /opt/locust/locustfile.py
      --worker
      --master-host=locust-master
    depends_on:
      - locust-master

  statsd-exporter:
    image: prom/statsd-exporter:v0.26.0
    ports:
      - "9102:9102"
      - "8125:8125/udp"
    command: >
      --statsd.listen-udp=:8125
      --web.listen-address=:9102

  grafana:
    image: grafana/grafana:11.0.0
    ports:
      - "3000:3000"
    environment:
      - GF_AUTH_ANONYMOUS_ENABLED=true
      - GF_AUTH_ANONYMOUS_ORG_ROLE=Admin
    volumes:
      - ./grafana/dashboards:/var/lib/grafana/dashboards
Run it locally to validate your test scripts:
docker compose up -d
# Open http://localhost:8089 for Locust UI
# Open http://localhost:3000 for Grafana dashboard
Once your scripts are solid locally, you can promote them to the ECS Fargate or EKS setup we covered earlier.
Conclusion
By this point in 2026, load testing on AWS isn’t a nice-to-have – it’s table stakes. Between k6, Locust, and the infrastructure patterns we walked through, there’s really no excuse for shipping to production blind.
Our take? k6 is the right call for teams on EKS or anyone pushing serious throughput. The Go runtime barely touches resources, the k6 Operator manages distribution without any hand-holding, and writing tests in JavaScript means pretty much anyone on the team can contribute. But if you’re a Python shop and need to model complex user behavior – decision trees, external library calls, the works – Locust gives you that flexibility without boxing you in.
The architecture choice matters just as much as the tool, though. A single instance is fine for a quick smoke test, but for anything production-grade, reach for distributed runners on ECS Fargate or EKS. Pre-warm your auto scaling before hitting peak load. Ship metrics to CloudWatch. Test from outside your VPC. And wire load tests into CI/CD so they actually run with every release, instead of gathering dust until someone remembers.
The cost argument is almost laughable. Ten Fargate tasks for 30 minutes runs about $2.50. Compare that to even one production incident caused by untested scaling behavior, and the math sorts itself out.
So start small. Write a single k6 script that hammers your most critical endpoint. Layer on more scenarios as you get comfortable. Upgrade to distributed runners when you start bumping into single-instance limits. Plug it all into CI/CD. Give it a month and you’ll have hard data telling you exactly where your system cracks and how much room you’ve got before it does.
Explore more like this

Aurora Serverless v2 + Bedrock: AI Database Queries in 2026
I connected Bedrock to our Aurora cluster last month. The first thing I asked it was “show me all customers who churned in Q1 but came back in Q2” —...

Terraform State Locking with S3 and DynamoDB in 2026
The moment two engineers run terraform apply at the same time without state locking, you have a race condition that can corrupt your entire infrastructure state. Both processes read the...


Comments