Kubernetes PSI Metrics GA: Pressure-Based Alerts for EKS Operators
Kubernetes 1.36 promoted PSI metrics to GA in May 2026. That is a small-looking observability change with a practical message: average CPU and memory graphs do not tell you when a node is under pressure.
That is why this post is intentionally practical. It does not try to turn Kubernetes PSI metrics into a product brochure. It treats the announcement, release, or vulnerability as an operating decision: what should a cloud team change, what can wait, what has to be measured, and which guardrails keep the fix from becoming a new source of downtime.
If you are connecting this to the existing BitsLovers library, start with Kubernetes 1.36 resource management, CloudWatch Container Insights on EKS, OpenTelemetry and CloudWatch, EKS Karpenter autoscaling, KEDA event-driven autoscaling, AI workloads on EKS. Those articles cover the adjacent platform patterns; this one focuses on pressure-based observability for EKS and Kubernetes resource management.
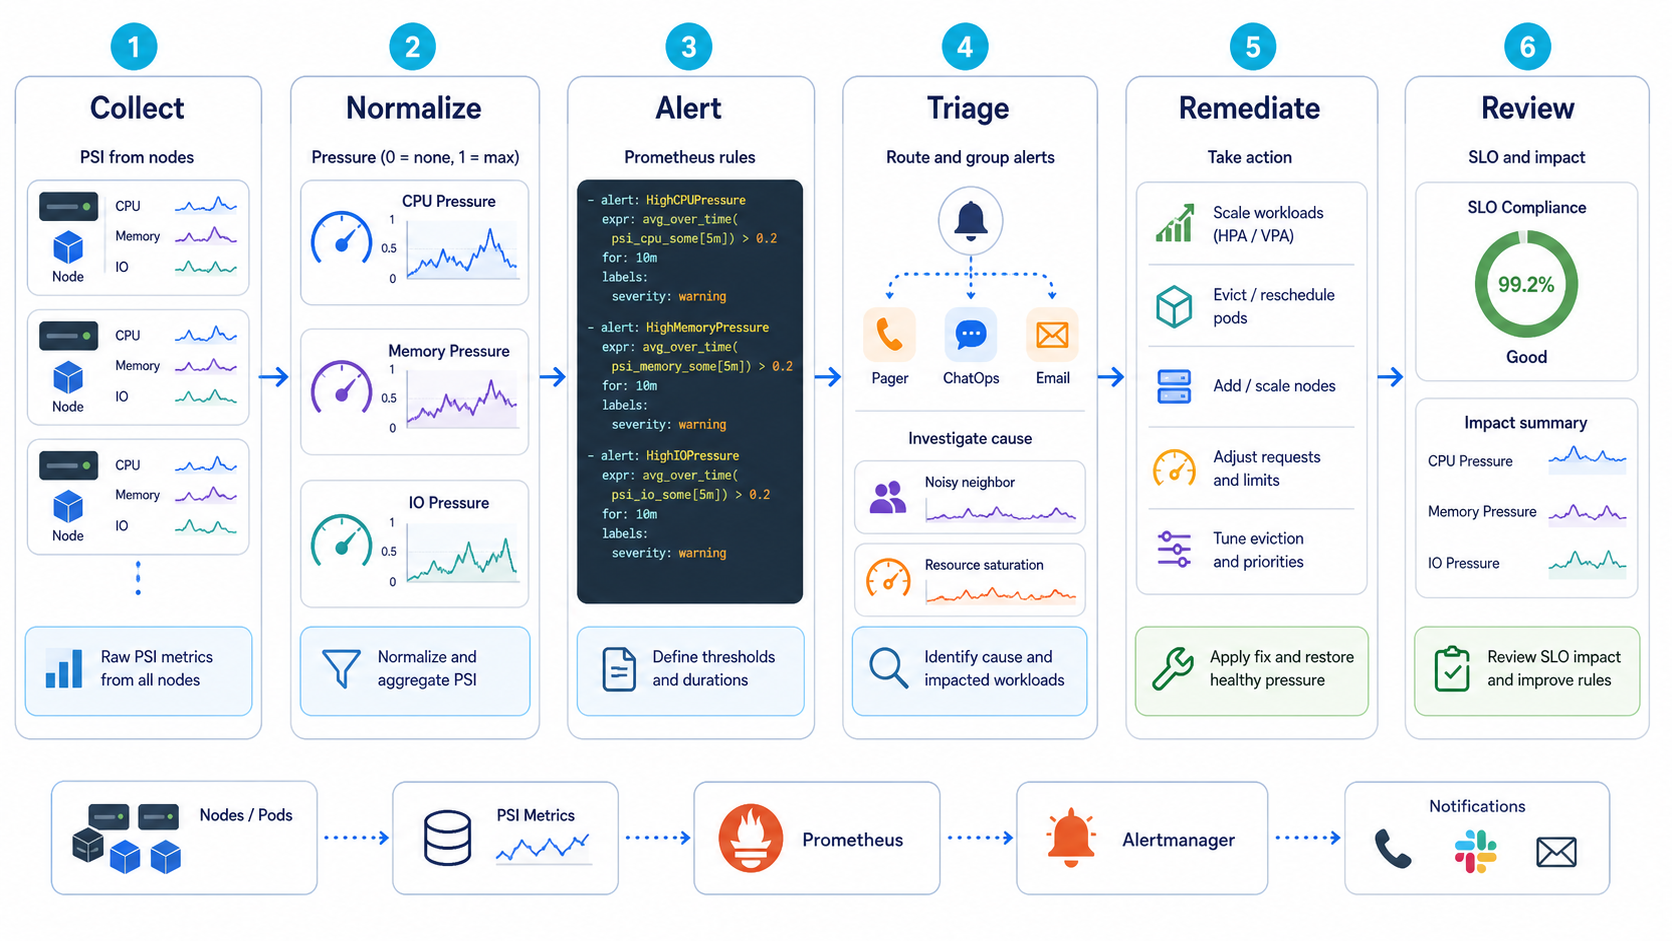
The workflow above is the recommended operating model. It keeps the discussion out of the abstract. You start with the signal, scope the blast radius, implement the smallest useful control, verify the result, and then turn the work into a repeatable runbook. That order matters. A lot of teams jump straight from announcement to tooling. That feels fast, but it usually skips ownership, rollback, and the boring evidence an auditor or incident reviewer will ask for later.
What Changed
Pressure Stall Information exposes time spent waiting on constrained CPU, memory, or IO resources. Kubernetes surfacing that signal gives operators a better view of contention. A node can look acceptable by average utilization and still make workloads wait. PSI helps explain that gap.
The date matters here because engineering teams already have plenty of stale guidance in their wikis. Treat this as a May 2026 operating note. If a vendor updates the documentation later, update the runbook and leave a revision note in the post. That is not editorial polish; it is how you keep technical content from becoming another unsafe copy-paste source.
PSI comes from the Linux kernel and reports pressure over time windows. Kubernetes exposing stable metrics makes it easier to integrate the signal into cluster observability. For EKS operators, the job is to route the metric through Prometheus, OpenTelemetry, CloudWatch, or another monitoring path and connect it to workload behavior.
Why Platform Teams Should Care
Capacity planning that only watches CPU utilization misses noisy neighbors, memory reclaim pain, IO stalls, and nodes that look fine until latency jumps. PSI is not a replacement for application SLOs. It is the missing context when an SLO burns and the old node charts say everything is fine.
This is also where cost and reliability get mixed together. A feature that looks like a security improvement can increase build time, data scanned, node churn, or operational review effort. A reliability feature can quietly move risk from the service team to the platform team. A new AI workflow can shorten analysis time and still create a governance problem if the identity model is weak. Good engineering writing should name that tradeoff.
For Kubernetes PSI metrics, the practical question is not “is this useful?” It is useful. The better question is where the control should live. If it belongs in a one-off project, document it there. If it belongs in the platform baseline, put it in CI, admission control, IAM, observability, or a shared runbook. Most teams get into trouble when they make that boundary implicit.
Operating Baseline
The baseline is a dashboard that puts PSI beside pod restarts, pending pods, throttling, node allocatable resources, HPA decisions, and application latency. PSI by itself is a diagnostic signal. Correlated with workload behavior, it becomes an operating tool.
| Signal | Use for | Do not use for |
|---|---|---|
| CPU pressure | Detecting runnable work waiting on CPU | Replacing request and limit design |
| Memory pressure | Spotting reclaim and memory contention | Ignoring OOM events |
| IO pressure | Finding storage or disk contention | Blaming the application first |
| Application latency | User impact | Explaining node-level cause alone |
The table is deliberately opinionated. It gives you a default answer before the exception shows up. Exceptions are fine; hidden exceptions are not. If someone wants to bypass the default, require a reason, an owner, and an expiration date. That one small rule prevents a lot of permanent “temporary” infrastructure.
Implementation Pattern
Start with warning alerts and dashboards. Page only after the signal is correlated with user impact.
groups:
  - name: kubernetes-psi
    rules:
      - alert: NodeHighMemoryPressure
        expr: avg_over_time(node_pressure_memory_some[10m]) > 0.20
        for: 15m
        labels:
          severity: warning
        annotations:
          summary: "Node memory pressure above 20 percent for 15 minutes"
          runbook: "Check pods, requests, limits, and recent deployments on this node."
The snippet is not meant to be pasted blindly. Use it as the shape of the implementation, then adapt names, account boundaries, tags, and approval gates to your environment. The useful part is the sequence: inspect, constrain, verify, and record evidence. If your process cannot produce evidence, it is not mature enough for production.
Controls, Metrics, And Evidence
The signal needs thresholds, but thresholds should start conservative.
| Metric | First use | Escalate when |
|---|---|---|
| CPU some/full pressure | Warn on sustained queueing | Correlates with latency or throttling |
| Memory pressure | Investigate reclaim and cache pressure | Pods restart or latency rises |
| IO pressure | Check logs, volumes, and local disk | Stateful workload SLO burns |
| Node pool pressure trend | Capacity planning | New deployments raise baseline |
Notice that the table separates a control from the evidence. A control without evidence is a hope. Evidence without an owner is a screenshot in a ticket that nobody trusts three months later. Tie each signal to a system that already has retention, access control, and review habits.
Rollout Plan
The rollout should be observational before it becomes a paging policy.
- Enable or collect PSI metrics in a non-critical cluster first.
- Graph PSI next to application latency and pod scheduling events for at least one normal traffic cycle.
- Create warning alerts with generous thresholds and no pager for the first two weeks.
- Review top pressure nodes and map them to workloads, requests, limits, and node pool type.
- Only page on PSI when it predicts or explains user-impacting symptoms.
This is where teams often overbuild. Start with the smallest production slice that proves the behavior. One non-critical cluster, one runner group, one application namespace, one account, or one data domain is enough. Then widen the blast radius only after you have a rollback path and a metric that proves the change did not make the system worse.
Gotchas
PSI makes pressure visible, but it does not tell you what decision to make by itself.
- A high PSI value on a batch node may be acceptable. The same value on a latency-sensitive API node may be bad.
- PSI can reveal poor request sizing, but it cannot fix bad limits or missing autoscaling policy.
- IO pressure can come from logs, image pulls, local disk, or persistent storage. Do not guess.
- If every alert is warning, nobody learns. Start with dashboards and review sessions.
- CloudWatch, Prometheus, and OpenTelemetry naming can differ. Standardize labels before sharing dashboards.
The uncomfortable lesson is simple: new platform features usually fail at the handoff points. The vendor feature works. The identity mapping is incomplete. The backup restores but not the secret. The scanner finds an issue but nobody owns the fix. The autoscaler drains a zone correctly but the application has a bad disruption budget. These are not edge cases. They are where production work lives.
Security, Reliability, And Cost Tradeoffs
The observability gain is better root cause analysis. The cost is another signal that can become noisy if turned into a pager too early. Treat PSI as a capacity and diagnosis metric first. Promote it to paging only when you have evidence that it predicts pain.
Use a scorecard before rolling the pattern to every team:
| Question | Good answer | Weak answer |
|---|---|---|
| Can we correlate pressure? | Pressure, latency, restarts, and deployment events share labels | Each graph lives in a different tool |
| Can we assign ownership? | Workload, namespace, and node pool are visible | Node name is the only clue |
| Can we act? | Runbook names request, limit, scaling, or node-pool action | Alert says investigate |
The weak answers are not moral failures. They are just not production answers yet. If your current state is weak, write the gap down, choose the next smallest fix, and keep the change contained until the evidence improves.
First 48 Hours In Practice
The first two days decide whether Kubernetes PSI metrics becomes a controlled platform improvement or another half-finished note in a chat thread. I would split the work into three windows: the first hour, the first business day, and the first week. The first hour is about scope. Do not change production yet unless the exposure is obvious. Name the owner, capture the source link, list affected systems, and decide whether this is emergency work or scheduled platform work.
By the end of the first business day, the team should have one working example. That could be one patched runner pool, one restored namespace, one repository review, one governed data domain, one EKS node group, or one shared VPC deployment. The exact target depends on the topic. The point is to choose a small production-shaped slice, not a toy. A lab that has no secrets, no real users, no deployment pressure, and no monitoring will hide the problems that matter.
The first-week goal is repeatability. If the change worked once because a senior engineer babysat it, you have a useful experiment, not a platform pattern. Turn the successful path into a runbook with commands, screenshots, expected output, rollback steps, and escalation rules. Then test it with someone who did not write the first version. That review will expose missing assumptions faster than another hour of polishing.
For pressure-based observability for EKS and Kubernetes resource management, the review meeting should be short and concrete. Ask what changed, which systems are in scope, which systems are intentionally out of scope, what evidence proves the control works, and what would make the team roll back. If the group cannot answer those five questions, the change is not ready to become a default.
| Owner | Decision to make | Evidence they should demand |
|---|---|---|
| Service owner | Confirms scope and business impact | Accepts or rejects the default action for CPU pressure |
| Platform owner | Turns the pattern into a shared control | Publishes the runbook, dashboard, and rollback path for Kubernetes PSI metrics |
| Security owner | Reviews risk and exception handling | Checks that CPU some/full pressure has usable evidence |
| FinOps or operations owner | Checks cost and toil | Watches whether Memory pressure creates recurring work |
One practical habit helps a lot: write the rollback criteria before the rollout starts. For Kubernetes PSI metrics, a rollback may mean re-enabling an old runner path, restoring a prior IAM policy, pausing an agent workflow, undoing an autoscaling setting, or reverting to a previous storage ownership model. Whatever the answer is, write it down. Operators make better decisions during incidents when the stop condition is already named.
Runbook Artifacts To Keep
A trustworthy runbook is not a wall of prose. It is a small set of artifacts that prove the system can be operated by more than one person. Keep the procedure, the evidence, and the exception list separate. Procedures change often. Evidence grows during exercises and incidents. Exceptions need owners and expiration dates because otherwise they become the real architecture.
| Artifact | What good looks like | Maintenance rule |
|---|---|---|
| Runbook page | One current procedure with commands, owners, and rollback | Update after every exercise or incident |
| Evidence folder | Screenshots, command output, logs, ticket IDs, and query results | Keep according to audit and incident policy |
| Exception register | Every skipped service, account, cluster, repo, or dataset | Owner plus expiration date required |
| Dashboard link | The live view operators use during rollout | Must show the metric in the control table |
The evidence should be boring enough to survive an audit and specific enough to help an engineer at 2 a.m. A command transcript showing warn on sustained queueing is useful. A dashboard screenshot with no time range is not. A ticket that says “verified” is weak. A ticket with the exact source, system, output, owner, and next review date is much stronger.
This also keeps trust resources honest. A blog post can point to AWS, Kubernetes, GitLab, or project documentation, but the local runbook has to say how your team interpreted that source. If the official document changes, the local procedure needs a review. If the source disappears, the team needs a replacement. That is why the trusted resources section at the end of this post is not decorative; it is part of the operating model.
Example Review Questions
Use these questions before making Kubernetes PSI metrics a default pattern:
- What is the smallest system where we proved this works with production-like constraints?
- Which team owns the control after the initial rollout is finished?
- Which metric tells us the change helped instead of simply adding process?
- What is the first rollback action if a high psi value on a batch node may be acceptable. the same value on a latency-sensitive api node may be bad.?
- What exception would we approve, and how long may that exception live?
- Which trusted source would force us to revisit the design if it changed?
Two questions deserve blunt answers. First, does the pattern reduce risk, or does it only move risk to another team? Second, can a new engineer follow the runbook without private context? If the answer to either question is no, keep the rollout narrow.
A Concrete Failure Scenario
Imagine the team accepts the default action for cpu pressure but ignores memory pressure. At first, the rollout looks successful. The dashboard turns green. The announcement is written. Then the first exception arrives. A service owner cannot meet the deadline, a cluster has an unusual constraint, or a repository breaks in a way the shared workflow did not predict. Without an exception register, the team handles that case in a side conversation. Two weeks later nobody remembers whether the exception was temporary.
That is the failure mode this article is trying to avoid. The technology can be good and the rollout can still decay. The fix is not more meetings. The fix is a small operating loop: define the default, record the exception, attach an owner, set an expiration date, and review the evidence. This is simple, but it is not optional for production work.
PSI can reveal poor request sizing, but it cannot fix bad limits or missing autoscaling policy. That gotcha should shape the rollout. Put it in the runbook as a check, not as a footnote. If a future operator has to rediscover it during an outage or audit review, the article failed to become operational knowledge.
When To Use This
Use this pattern when you operate Kubernetes clusters where node contention and workload latency are hard to connect using CPU and memory utilization alone.
Do not use it when you do not yet have basic pod, node, and application SLO telemetry in place. That boundary is important because the wrong abstraction can make a simple system harder to operate. Sometimes the best platform decision is to leave a feature out of the shared baseline and document a local exception instead.
Trusted Resources
These are the sources I would keep next to the runbook:
- Kubernetes PSI Metrics GA blog
- Kubernetes node pressure eviction
- Kubernetes resource management
- CloudWatch Container Insights
- OpenTelemetry Collector
- Prometheus alerting rules
I am intentionally marking one uncertainty: metric names and collection paths depend on your distribution and monitoring stack, so validate them in your own EKS environment. Treat the article as an operating guide, not as a replacement for the vendor documentation. The source links above are the authority when a limit, feature state, or mitigation changes.
The Practical Takeaway
PSI is not another graph to admire. It is the pressure signal you use when the cluster feels slow and average utilization is lying.
Explore more like this

Aurora Serverless v2 + Bedrock: AI Database Queries in 2026
I connected Bedrock to our Aurora cluster last month. The first thing I asked it was “show me all customers who churned in Q1 but came back in Q2” —...
Terraform State Locking with S3 and DynamoDB in 2026
The moment two engineers run terraform apply at the same time without state locking, you have a race condition that can corrupt your entire infrastructure state. Both processes read the...

Comments