
CloudWatch Managed Prometheus Collectors on EKS: Delete the Scraper, Keep the Metrics

On July 31, 2026, AWS shipped managed Prometheus collectors for Amazon CloudWatch. The pitch is short: you hand CloudWatch a scrape configuration and a VPC connection, and AWS provisions, scales, and runs the scraper for you. No DaemonSet. No StatefulSet. No OpenTelemetry Collector you have to upgrade at 2 a.m. because a memory leak in the batch processor is OOM-killing pods on your biggest node group.
That’s the marketing. The engineering reality is more interesting, and the pricing math has a break-even point that AWS does not spell out anywhere on the pricing page.
Here’s the number that matters most, and I’ll show the arithmetic later: CloudWatch charges $0.50 per GB of OpenTelemetry metric ingestion, and AWS itself states that a typical data point with 10 to 15 attributes runs 300 to 600 bytes. Amazon Managed Service for Prometheus charges $0.90 per 10 million samples. Do the division and the crossover sits around 180 bytes per data point. Kubernetes metrics are label-heavy and almost never that small. For the same workload, CloudWatch OTLP ingestion can cost 1.7x to 3.3x what AMP charges per sample.
That does not make managed collectors a bad deal. It means you need to know which of the four collection paths you’re actually buying, and there’s a fifth option at $0.08 per GB that most teams will miss entirely.
What you were doing before, and why it hurt
If you run Prometheus metrics on EKS today you’re probably in one of three camps.
The first camp runs kube-prometheus-stack from the Prometheus community Helm chart. You get Prometheus Operator, ServiceMonitor and PodMonitor CRDs, node-exporter as a DaemonSet, kube-state-metrics as a Deployment, Alertmanager, and Grafana. It works. It’s also a distributed system you now own: WAL corruption after an ungraceful node termination, PVC resize dances when retention creeps up, and a Prometheus pod that grows its resident set every time a developer adds a label with a pod name in it. The full walkthrough of running Prometheus and Grafana on EKS yourself covers what that looks like end to end, and the honest summary is that the install takes an afternoon while the operations take forever.
The second camp runs Amazon Managed Service for Prometheus with a self-managed ADOT collector. Storage is somebody else’s problem, but you still own the scraper. You still tune memory_limiter, still size the collector, still get paged when a scrape target starts emitting a 200 MB /metrics payload.
The third camp already uses the AMP managed collector, the agentless scraper AWS launched for AMP workspaces. That camp has the least to gain from this launch, and I’ll get to why.
Everyone in camps one and two shares the same tax: the scraper is infrastructure you didn’t want, sitting in the critical path of your ability to know whether production is healthy. When the collector dies, you don’t get an alert about the thing that broke. You get silence, which is worse.
What AWS actually runs for you now
A managed collector is not a pod in your cluster. AWS provisions an Elastic Network Interface in each subnet you name at creation time, and the collector reaches into your VPC through those ENIs. It scrapes over HTTPS, then delivers the result in OpenTelemetry Protocol format to your CloudWatch dataset through a VPC endpoint. The managed Prometheus collectors documentation is explicit that the scraped data never crosses the public internet.
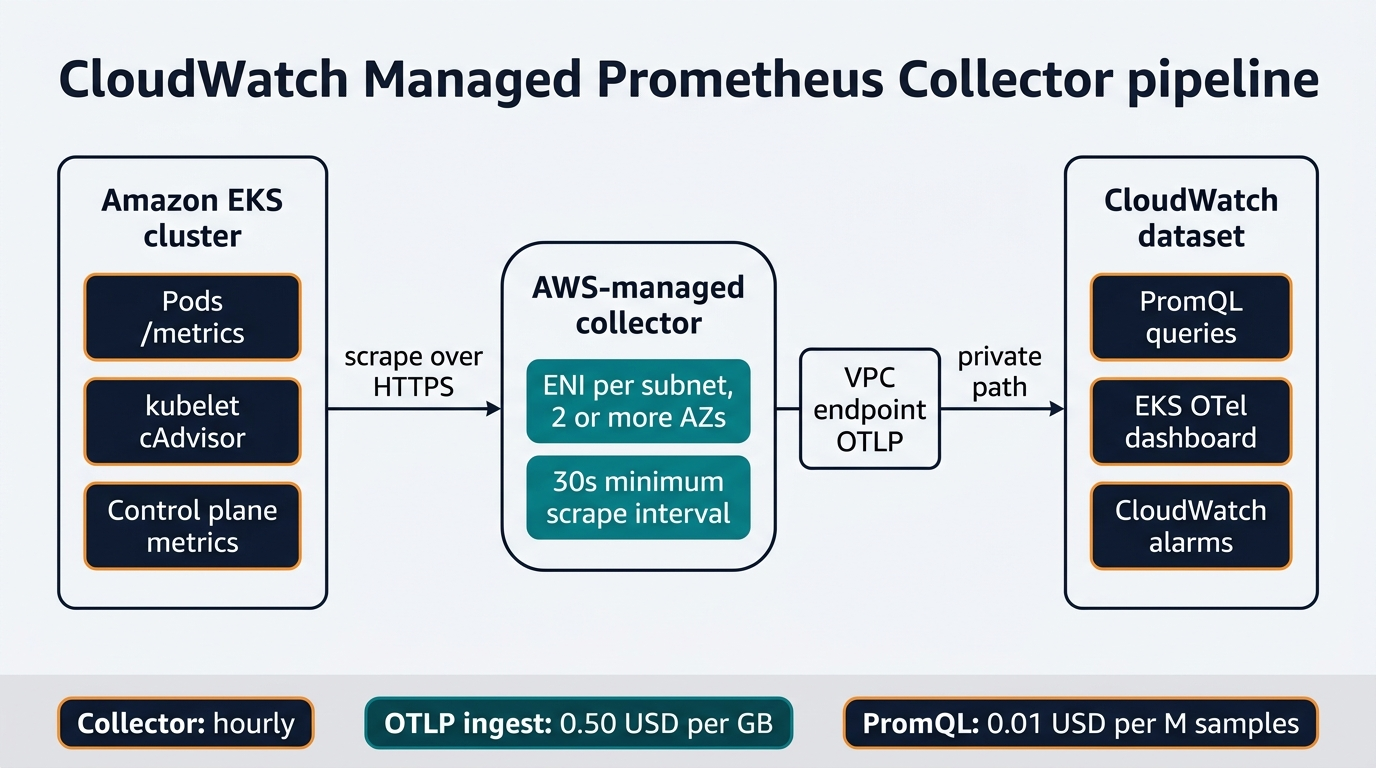
Once the data lands, you query it with PromQL. Not Metrics Insights SQL, not GetMetricData math expressions. Actual PromQL, alongside your AWS vended metrics in the same dataset. CloudWatch also builds an automatic dashboard named EKS OTel with no widget work from you.
The collector enriches every EKS metric with attributes that identify where it came from: instrumentation scope, account, Region, an inferred unit, plus cluster name and cluster ARN. Those become PromQL label selectors. That’s genuinely useful for multi-cluster queries, and it’s also part of why your per-data-point byte count goes up, which is part of why your bill goes up. Enrichment is not free when you’re billed by the byte.
Scope beyond Kubernetes is broader than the EKS story suggests. The launch covers EKS via Kubernetes service discovery, ECS via DNS-based discovery through AWS Cloud Map, EC2 via direct instance scraping, and open monitoring endpoints on MSK and OpenSearch Service. If you’ve been bolting a Prometheus exporter onto an MSK cluster to get broker JMX metrics somewhere useful, that path is now managed too.
One availability caveat worth reading twice: the feature is available in every Region where the CloudWatch OTLP endpoint exists, except Asia Pacific (New Zealand). Check your Region before you plan a migration.
Four collection paths, compared honestly
The word “managed” now means four different things depending on which destination you pick. This is the table I wish AWS had published.
| Path | Who runs the scraper | Storage backend | Query language | Per-series charge | Biggest drawback |
|---|---|---|---|---|---|
Self-hosted kube-prometheus-stack |
You | Your EBS volumes | PromQL | None | Every upgrade, WAL, PVC, and OOM is yours |
| AMP + self-run ADOT collector | You | AMP | PromQL | None | Storage solved, scraper toil unchanged |
| AMP + AMP managed collector | AWS | AMP | PromQL | None | Data lives outside CloudWatch alarms and datasets |
| CloudWatch managed collector | AWS | CloudWatch dataset | PromQL | None | $0.50/GB ingestion, $0.01 per M samples queried |
| Container Insights with OpenTelemetry | AWS | CloudWatch dataset | PromQL | None | Fixed receiver set, no arbitrary app scraping |
Sources: CloudWatch managed collectors doc, AMP managed collector setup, CloudWatch pricing, AMP pricing, as of August 2026.
Notice that last row. Container Insights with OpenTelemetry for EKS collects at 30-second granularity using cAdvisor, Prometheus Node Exporter, kube-state-metrics, NVIDIA DCGM, AWS Neuron Monitor, and EFA receivers, enriches each metric with up to 150 labels, and charges $0.08 per GB instead of $0.50. Same PromQL. Same dataset. Same automatic dashboards. One sixth of the ingestion price.
If the metrics you want are the standard Kubernetes infrastructure set, running them through a managed collector at $0.50/GB when Container Insights would carry them at $0.08/GB is a six-fold overpayment for identical data. The earlier Container Insights on EKS setup guide predates the OpenTelemetry mode, and the delta is worth understanding before you pick.
The cost model, with the arithmetic shown
AWS publishes worked examples for both services, so let me normalize them to a single unit: 1,000 metric series scraped every 30 seconds for a 744-hour month. That’s 1,000 ÷ 30 × 3,600 × 744 = 89.28 million samples.
| Cost component | Rate | Cost per 1,000 series/month | Source |
|---|---|---|---|
| AMP metric ingestion | $0.90 per 10M samples (first 2B) | $8.04 | AMP pricing |
| AMP storage | $0.03 per GB | ~$0.01 | AMP pricing |
| AMP query (QSP) | $0.10 per billion samples | fractions of a cent | AMP pricing |
| AMP managed collector | $0.04/collector-hour + $0.03 per 10M collected | $30.03 | AMP pricing |
| CloudWatch OTLP ingest @ 300 B/point | $0.50 per GB | $13.39 | CloudWatch pricing |
| CloudWatch OTLP ingest @ 400 B/point | $0.50 per GB | $17.86 | CloudWatch pricing |
| CloudWatch OTLP ingest @ 600 B/point | $0.50 per GB | $26.78 | CloudWatch pricing |
| Container Insights OTel @ 400 B/point | $0.08 per GB | $2.86 | CloudWatch pricing |
| CloudWatch PromQL query | $0.01 per million samples scanned | see below | CloudWatch pricing |
Rates from the Amazon CloudWatch pricing page and the Amazon Managed Service for Prometheus pricing page, US East (N. Virginia), retrieved August 2026. Regional rates differ.
Three things fall out of that table.
Ingestion crossover is around 180 bytes. AMP’s $0.90 per 10 million samples works out to $9.0e-8 per sample. CloudWatch’s $0.50/GB works out to $0.50 × B ÷ 10⁹ per data point of B bytes. Set them equal and B ≈ 180 bytes. Below that, CloudWatch is cheaper. Above it, AMP is. AWS’s own guidance says a data point with 10 to 15 attributes runs 300 to 600 bytes, and Kubernetes pod metrics routinely carry namespace, pod, container, node, service, and workload labels before you add anything of your own. Assume you’re above the line.
There is no per-series charge, and that’s the real win. Classic CloudWatch custom metrics cost $0.30 per metric per month for the first 10,000. AWS’s own example 22 puts 5,000 unique series at 500 bytes per point through the OTLP endpoint for $54 per month, against $1,500 per month for the same 5,000 series as classic custom metrics. That’s a 28x difference. If you’ve ever abandoned a Prometheus-to-CloudWatch bridge because unique dimension combinations made it unaffordable, that objection is gone.
Query pricing is where CloudWatch loses badly on paper. CloudWatch bills PromQL at $0.01 per million samples scanned, which is $10 per billion. AMP bills $0.10 per billion query samples processed. That is a 100x difference in the per-sample query rate. AWS’s AMP example prices an alerting rule scanning 438 million samples per month at $0.04; the same scan volume against CloudWatch costs $4.38, plus the alarm itself.
The mitigation is real, though. Queries run through the CloudWatch console, including dashboards and Query Studio, are free. So a team that lives in CloudWatch dashboards pays nothing for interactive querying and only pays for programmatic access: PromQL alarm evaluations, Grafana panels hitting the API, and anything a script runs on a cron. AWS’s example 23 puts 500 programmatic queries a day at 10,000 samples each at $1.50 per month. Small in absolute terms. Just don’t point a 30-second-refresh Grafana wall at it and expect the AMP bill you’re used to.
One gap I could not close: the announcement and the documentation both say managed collectors are “charged by the hour,” but I could not find a published per-hour rate for the CloudWatch-destination collector in the pricing page content. The AMP agentless collector is $0.04 per collector-hour, which is $29.76 for a 744-hour month, and that’s the closest published anchor. Treat the CloudWatch collector hourly line as unverified until AWS publishes it, and check your first bill rather than your first estimate.
Scrape configuration: what’s supported, what isn’t
The collector takes a base64-encoded Prometheus YAML blob. Standard format, real relabel_configs, real metric_relabel_configs. Not a proprietary DSL. That’s the good news.
The supported surface is smaller than upstream Prometheus, and the documentation contradicts itself in one place that will cost you an afternoon if you don’t notice.
The CloudWatch scraper configuration page lists static_configs and dns_sd_configs as the supported discovery mechanisms and says nothing about Kubernetes. The AMP managed collector page says the opposite: kubernetes_sd_config is the only service discovery config supported, because EKS is the only supported source. The launch announcement mentions Kubernetes service discovery for EKS and DNS discovery for ECS. Reading all three together, the discovery mechanism depends on the source type, and the CloudWatch page is describing the VPC-connected and ECS cases.
Don’t guess. Call GetDefaultScraperConfiguration and start from what the API hands you:
aws amp get-default-scraper-configuration \
  --query 'configuration' --output text | base64 -d > eks-config.yaml
Here’s a trimmed configuration that scrapes pods, cAdvisor, and the EKS control plane. The control plane detail matters: EKS clusters expose API server metrics, and clusters on Kubernetes 1.28 or above also expose kube-scheduler and kube-controller-manager through the metrics.eks.amazonaws.com API group, per the EKS raw control plane metrics documentation.
global:
  scrape_interval: 30s
  scrape_timeout: 10s
  external_labels:
    environment: production

scrape_configs:
  - job_name: pod_exporter
    kubernetes_sd_configs:
      - role: pod
    metric_relabel_configs:
      # Drop Go runtime internals nobody alarms on.
      - source_labels: [__name__]
        regex: 'go_(gc|memstats|threads)_.*'
        action: drop
      # Drop the label that makes cardinality explode.
      - regex: 'pod_template_hash|controller_revision_hash'
        action: labeldrop

  - job_name: cadvisor
    scheme: https
    authorization:
      type: Bearer
      credentials_file: /var/run/secrets/kubernetes.io/serviceaccount/token
    kubernetes_sd_configs:
      - role: node
    relabel_configs:
      - action: labelmap
        regex: __meta_kubernetes_node_label_(.+)
      - replacement: kubernetes.default.svc:443
        target_label: __address__
      - source_labels: [__meta_kubernetes_node_name]
        regex: (.+)
        target_label: __metrics_path__
        replacement: /api/v1/nodes/$1/proxy/metrics/cadvisor

  - job_name: kcm-metrics
    kubernetes_sd_configs:
      - role: endpoints
    metrics_path: /apis/metrics.eks.amazonaws.com/v1/kcm/container/metrics
    scheme: https
    bearer_token_file: /var/run/secrets/kubernetes.io/serviceaccount/token
    relabel_configs:
      - source_labels:
          - __meta_kubernetes_namespace
          - __meta_kubernetes_service_name
          - __meta_kubernetes_endpoint_port_name
        action: keep
        regex: default;kubernetes;https
Then create the scraper against a CloudWatch dataset instead of an AMP workspace. Note the CLI still lives under aws amp, which tells you something about the plumbing underneath:
aws amp create-scraper \
  --alias "eks-prod-metrics" \
  --source eksConfiguration="{clusterArn='arn:aws:eks:us-west-2:123456789012:cluster/prod', \
    securityGroupIds=['sg-0abc123'], \
    subnetIds=['subnet-0aaa111','subnet-0bbb222']}" \
  --scrape-configuration configurationBlob=$(base64 -w 0 eks-config.yaml) \
  --destination cloudWatchConfiguration="{datasetArn='arn:aws:cloudwatch:us-west-2:123456789012:dataset/default'}"
Four constraints in that command will bite you if you skim. Subnets must number at least two, in at least two Availability Zones. Each subnet needs at least one free IP address, because the collector claims an ENI per subnet, and anyone who has run a busy cluster on the VPC CNI knows how quickly subnet IP space disappears on EKS. Your cluster must have private endpoint access enabled, public-and-private is fine but private is mandatory. And the cluster, the scraper, and the destination must all live in the same Region.
Cardinality control changes meaning under byte-based billing
This is the part that experienced Prometheus operators need to re-learn, and it’s the most useful thing in this article.
Under AMP, you’re billed per sample ingested. A metric with 4 labels and a metric with 40 labels cost exactly the same to ingest. Trimming labels with labeldrop reduces your storage line, which was $0.10 in AWS’s own 10-node example, so it’s essentially free money you don’t get. The only lever that moves the AMP ingestion bill is reducing the number of series or lengthening the scrape interval.
Under CloudWatch, you’re billed by the uncompressed size of the OTLP payload, and AWS is explicit that this includes metric values, names, timestamps, all attributes, and resource metadata. HTTP headers and compression overhead are excluded, as is metadata CloudWatch adds after ingestion.
That inverts the optimization. A labeldrop rule that removes three 30-byte labels from a 400-byte data point cuts roughly 22% off your ingestion bill for that series. Directly. Proportionally. Every month.
Practical rules I’d apply on day one:
Drop pod_template_hash and controller_revision_hash everywhere. They’re deployment-scoped noise, they carry no query value, and on a cluster with aggressive rollouts they mint new series on every deploy. Node-scoped labels churn the same way if you run aggressive consolidation, so audit those too.
Drop the go_* and process_* families from application jobs unless you actually alarm on them. Most teams scrape them because the client library exposes them, then never write a single query against them.
Keep histogram buckets you use and drop the rest with a keep rule on le. A histogram with 20 buckets is 20 series per label combination, and every bucket carries the full label set.
Enable gzip on your /metrics endpoints. AWS calls this out specifically: compression lowers VPC data transfer cost between the collector and your targets. It does not reduce the number of metrics CloudWatch ingests, and since billing is on the uncompressed payload, it does not reduce your ingestion charge either. It only cuts the network line item. Worth doing, but don’t expect it to fix an ingestion bill.
Also budget for that network line. VPC data transfer between the collector ENIs and your targets is billable and does not appear in either pricing page’s examples. Cross-AZ scraping is the expensive shape, and the collector picks targets by discovery, not by zone affinity.
Hard limits worth writing on a whiteboard
| Limit | Value | Adjustable |
|---|---|---|
| Minimum scrape interval | 30 seconds | No |
| Scrapers per Region per account | 10 | Yes, quota request |
Max /metrics response body |
50 MB | No |
| Max endpoints per scraper | 30,000 | No |
| Max scrape configuration size | 256 KB | No |
| Subnets required | 2+, in 2+ AZs | No |
static_configs targets |
IP addresses only | No |
| DNS names allowed in config | kubernetes.default.svc only |
No |
| Target authorization | Bearer with the service account token file |
No |
file_sd_configs, Consul, Eureka |
Not supported | No |
remote_write / remote_read |
Not applicable | No |
| Cluster endpoint access | Private access required | No |
| Region coverage | All OTLP Regions except Asia Pacific (New Zealand) | No |
Limits from the AMP managed collector documentation and the CloudWatch scraper configuration page, August 2026.
The 30-second floor deserves its own paragraph. If you autoscale on custom metrics, alert on latency spikes that resolve in 45 seconds, or run anything where a one-minute detection window is a business problem, a managed collector cannot serve you. Self-hosted Prometheus will happily scrape at 5 seconds. This limit is not a soft quota you can escalate.
Three gotchas the docs mention quietly:
Cluster ARN reuse. Scrapers bind to the EKS cluster ARN, not to the cluster’s identity. Delete a cluster, create a new one with the same name in the same account and Region, and the ARN is reused. Your old scraper will happily start collecting from the new cluster. Scrapers are deleted separately from clusters, and nothing warns you.
The source is immutable. UpdateScraper changes the alias, the configuration, and the destination. It cannot change the source. Repointing a scraper at a different cluster means delete and recreate, which means a gap in your metrics unless you build the new one first.
Deleting a scraper removes its ENIs, and AWS says to allow a few minutes. If you have Terraform destroying a subnet in the same apply, expect a dependency violation.
For debugging, the up metric is the whole toolkit. Absent means the collector never found the endpoint, which usually points at relabel_configs, the discovery role, or VPC DNS being disabled. Present but always 0 means discovery worked and the scrape failed, so curl the endpoint yourself and check scheme, port, the 200 response, valid exposition format, and the 50 MB body limit. Present and above 0 means data is flowing and you’re looking in the wrong place. count(up) tells you how many endpoints you’re actually scraping, which is the fastest way to find out you blew past a limit.
Collectors also vend their own logs to CloudWatch Logs covering target discovery, scrape failures, and configuration errors. Those log groups are the first thing to check when metrics go quiet, and they’re queryable with the same tag-scoped Logs Insights patterns you’d use anywhere else in CloudWatch.
Migrating off kube-prometheus-stack
The hardest part of this migration is not the scraper. It’s that kube-prometheus-stack expresses scrape configuration as ServiceMonitor and PodMonitor custom resources, and a managed collector accepts none of them. It wants flat Prometheus YAML. Every CR your teams created through GitOps has to be flattened into scrape_configs by hand, and if you’ve been managing that stack through Helm with per-team values files, that inventory is bigger than you think.
A sequence that works:
1. Inventory what you actually scrape. Dump the generated config out of the running Prometheus pod rather than reading the CRs:
kubectl exec -n monitoring prometheus-kube-prometheus-stack-prometheus-0 \
  -c prometheus -- cat /etc/prometheus/config_out/prometheus.env.yaml \
  > current-scrape-config.yaml
grep -c 'job_name' current-scrape-config.yaml
2. Rank jobs by series count, then delete the bottom half. Run topk(20, count by (job) ({__name__=~".+"})) against your current Prometheus. Most clusters find that two or three jobs produce 80% of series, and half the jobs produce metrics nobody has ever queried. Migrating jobs you don’t need at $0.50/GB is a choice.
3. Enable cluster access. Set the cluster authentication mode to API or API_AND_CONFIG_MAP, and AWS creates the access entry policy automatically. The generated policy grants get, list, and watch on nodes, nodes/proxy, nodes/metrics, services, endpoints, pods, ingresses, and configmaps, plus get on kcm/metrics and ksh/metrics in the metrics.eks.amazonaws.com group, plus get on the non-resource URL /metrics. If you’re still on aws-auth ConfigMap, there’s a manual path with a ClusterRole named aps-collector-role bound to a user named aps-collector-user via eksctl create iamidentitymapping. Worth reviewing against your existing EKS RBAC posture before you apply it, because that role reads configmaps cluster-wide.
4. Run both for two weeks. Create the scraper while the stack is still running. Compare a handful of PromQL queries against both backends. Scrape intervals differ, so expect small numeric drift on rate windows; expect zero drift on series presence.
5. Port alerts, and accept the recording rule gap. Prometheus alerting rules become CloudWatch alarms that evaluate PromQL expressions. Each one costs the standard alarm price plus query charges based on samples scanned per evaluation, so an alarm over a wide series set costs more than an alarm over a narrow one. Alertmanager routing, inhibition, and grouping have no direct equivalent, and neither do recording rules. If your dashboards depend on precomputed recording rules for speed, you’ll be paying to scan raw series instead. This is the single most underestimated item in the migration, and the CloudWatch alarms deep dive is worth re-reading for the pricing mechanics.
6. Repoint Grafana, then scale down. Swap the data source, verify the dashboards you care about, then scale the Prometheus StatefulSet to zero and leave it there for a week before you delete the PVCs. Deleting storage is the one step you cannot undo.
If you’re on AMP with the AMP managed collector already, your migration is a destination swap: cloudWatchConfiguration with a datasetArn instead of ampConfiguration with a workspaceArn. Same CLI, same scrape config, same limits. Model the query cost before you do it, because the 100x difference in per-sample query pricing is the one thing that changes materially, and it changes against you if you query programmatically.
Across a fleet, this is also where organization-level telemetry policy earns its keep. If you’re rolling this out to more than a handful of accounts, automate scraper creation through your account-vending pipeline rather than creating fifty of them by hand.
When to stay self-managed
I’ll be direct, because hedging here is useless.
Stay self-managed if any of these is true for you. You need a scrape interval below 30 seconds. You depend on recording rules for dashboard performance or cost. You depend on Alertmanager routing, inhibition, or silence workflows that CloudWatch alarms cannot express. You remote_write to more than one backend, whether that’s Thanos, Mimir, Grafana Cloud, or a vendor. You have clusters outside EKS, on-premises, or in another cloud, because a managed collector’s source types do not cover them. Your scrape targets require mTLS or any auth that isn’t a Bearer token from the service account file. You run more than 10 clusters per Region and don’t want a quota ticket in the critical path of cluster provisioning. Your metrics are label-heavy at high volume and the byte-based ingestion math genuinely loses to per-sample pricing at your scale.
Switch to managed collectors if you run one to ten EKS clusters, you have no dedicated observability engineer, your alerting already lives in CloudWatch alarms and your logs already live in CloudWatch Logs, and the thing you actually want is control plane plus workload metrics queryable with PromQL without a scraper to babysit.
And here’s the recommendation I’d defend in a design review: for the standard Kubernetes infrastructure metric set, turn on Container Insights with OpenTelemetry at $0.08 per GB and stop there. Add a managed collector only for your application’s own /metrics endpoints, the ones Container Insights receivers don’t cover. That split gets you the automatic EKS OTel dashboard, PromQL, and no agents, while keeping the expensive $0.50/GB path scoped to the metrics that only you can produce.
Most teams evaluating this will reach for the managed collector first because it’s the new thing in the announcement, pipe cAdvisor and kube-state-metrics through it, and pay six times what Container Insights would have charged for byte-identical data. Don’t be that team.
If you’re still choosing between AWS-native and a third-party platform for the whole observability stack, the tradeoffs in Datadog versus CloudWatch versus Grafana haven’t changed much, but the “CloudWatch can’t do Prometheus” objection is now retired. A tweet with 749 views summed up the community reaction better than the press release did: CloudWatch can query metrics with PromQL and now scrapes Prometheus endpoints without an agent, and CloudWatch might actually not suck anymore.
Operational reality after the cutover
Two things change about how you operate once the scraper isn’t yours.
You lose the ability to shell into the collector. There’s no pod to kubectl logs, no /targets page to load, no local WAL to inspect. What you get instead is describe-scraper, the vended CloudWatch Logs, and the up metric. That’s a smaller toolkit than you’re used to, and the first outage where a target silently stops being discovered will feel worse than it would have with a Prometheus you could poke at.
You also inherit a new failure mode: quota. Ten scrapers per Region per account is a soft limit, but soft limits become hard limits at 3 a.m. on a Saturday when a cluster-provisioning pipeline tries to create the eleventh. Request the increase before you need it, and keep scraper creation out of the critical path of cluster creation if you can.
Cross-account monitoring gets simpler than the AMP equivalent. AWS recommends CloudWatch metric centralization rather than cross-account scrapers, and the first copy of metrics into a monitoring account is free, with additional copies at $0.05 per GB. Compare that to the AMP cross-account path, which requires a source role trusted by scraper.aps.amazonaws.com, a target role with AmazonPrometheusRemoteWriteAccess, and an sts:ExternalId condition pinned to the scraper ARN, created once per source-target pair. Centralization is a materially better story.
Finally, keep a decommissioned copy of your Prometheus config in version control. Not because you plan to go back, but because it’s the only complete record of what you used to scrape, and six months from now somebody will ask why a metric disappeared.
The one thing to take away
Managed Prometheus collectors remove real toil, and the absence of a per-series charge finally makes CloudWatch a legitimate Prometheus backend rather than a compromise. Just don’t confuse “managed” with “cheapest”: run your infrastructure metrics through Container Insights with OpenTelemetry at $0.08 per GB, reserve the $0.50 per GB collector path for application metrics only, and trim labels aggressively, because under byte-based billing every label you drop is money you keep.
Sources
- Amazon CloudWatch announces managed Prometheus collectors (AWS What’s New, July 31, 2026)
- Amazon CloudWatch managed Prometheus collectors (CloudWatch User Guide)
- Integrate Amazon EKS with managed collectors (CloudWatch User Guide)
- Scraper configuration (CloudWatch User Guide)
- Set up managed collectors for Amazon EKS (Amazon Managed Service for Prometheus User Guide)
- Amazon CloudWatch pricing (retrieved August 2026)
- Amazon Managed Service for Prometheus pricing (retrieved August 2026)
- Fetch control plane raw metrics in Prometheus format (Amazon EKS User Guide)
- Allowing IAM roles or users access to Kubernetes objects on your EKS cluster (Amazon EKS User Guide)
- Prometheus configuration reference (prometheus.io)
Explore more like this

Cloud IoT Security: Zero Trust, Identity, and Signed Updates
On September 11, 2026, the Cyber Resilience Act’s incident-reporting rules start applying in the European Union. That is 22 days after this article’s publication date. A manufacturer that learns of...

Kill the Docker Hub Token: OIDC Trust for GitHub Actions
On July 31, 2026, Docker shipped OIDC connections for GitHub Actions to any organization on a Docker Team, Docker Business, or Docker Hardened Images subscription, plus organizations in the Docker-Sponsored...

Bedrock Web Search: Grounding an Agent Without Building a Scraper
On August 4, 2026, AWS made Web Search on Amazon Bedrock generally available, and the entire integration surface is one JSON object: {"type": "web_search"}. That is the whole change from...

Comments