
Java Containers on ECS and EKS: Fix JVM Memory, CPU Throttling, and Classpath Drift

A Java service can pass its tests, deploy cleanly, and die under load with exit code 137 even though the heap graph never reaches the container limit. Another service can start after a routine host patch and load a different JAR from the same image. Both failures look mysterious from the application layer. Neither is random.
The JVM is a normal Linux process inside a cgroup. It shares the host kernel, consumes heap and non-heap memory, creates threads based partly on the processor count it detects, and resolves classpath entries from the container filesystem. If those inputs differ from the limits in an ECS task definition or Kubernetes Pod, the process makes reasonable decisions with the wrong numbers.
AWS published a focused Java container guide on July 20, 2026 after seeing two recurring failure groups: resource detection mismatches and nondeterministic classpath resolution. This article turns those mechanisms into a repeatable diagnostic and deployment pattern for ECS, EKS, and Fargate.
A memory limit is not a heap limit
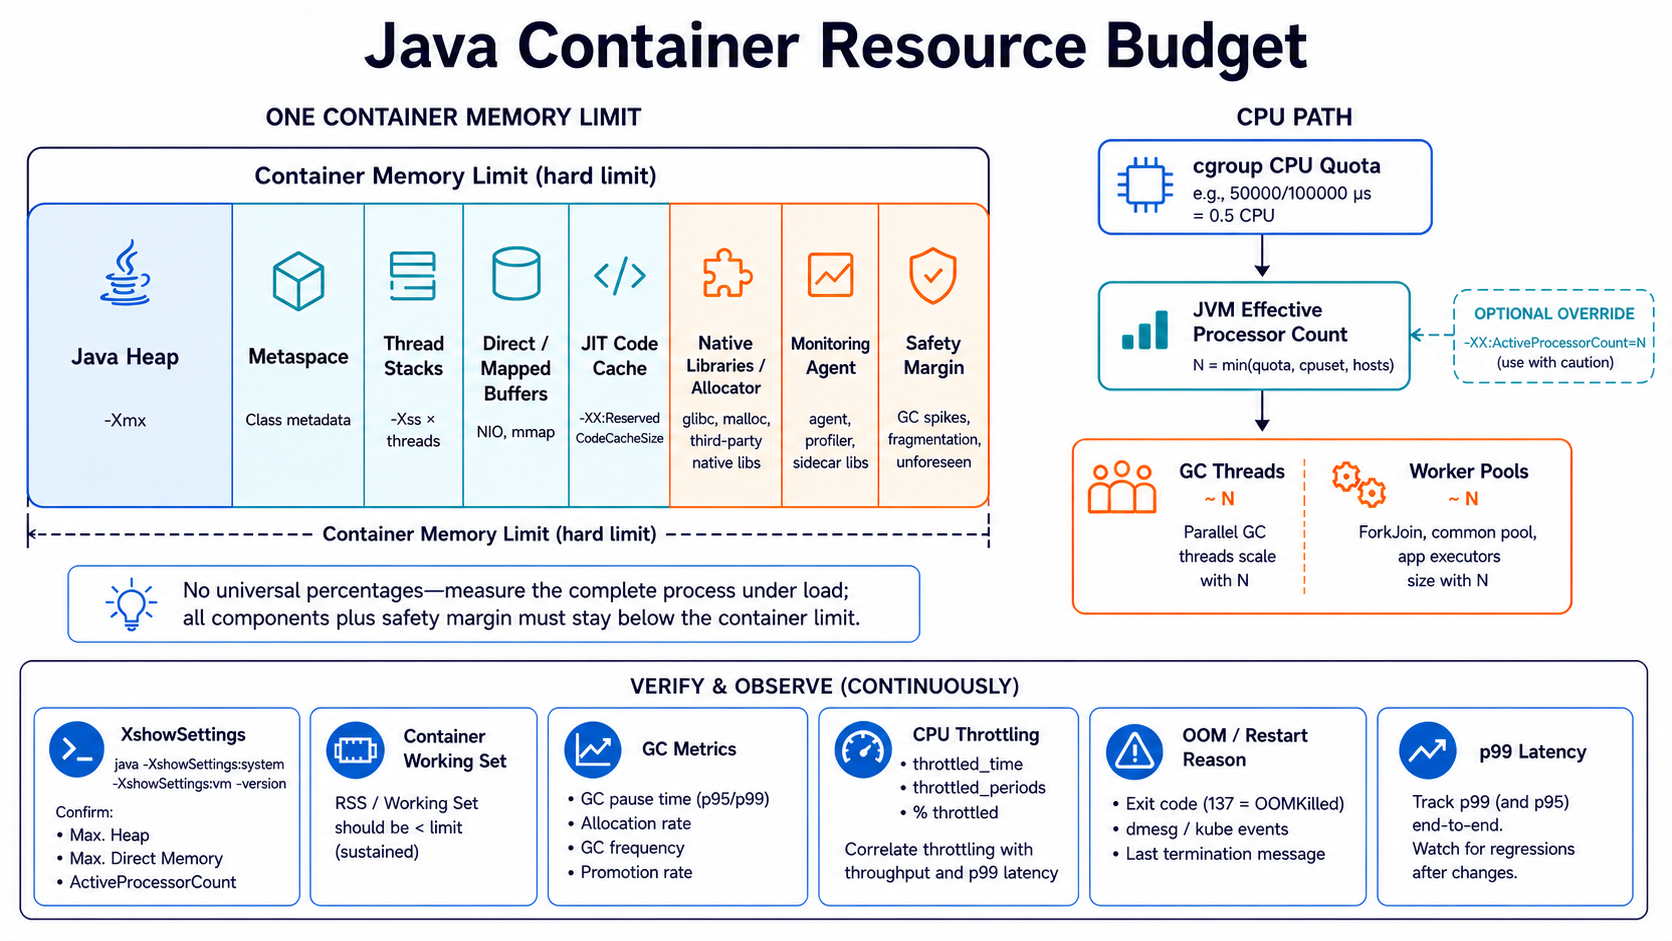
Suppose an EKS container has an 8 GiB memory limit and the JVM uses -XX:MaxRAMPercentage=75. The maximum heap is roughly 6 GiB. That leaves about 2 GiB for everything else, but “everything else” is substantial:
- Metaspace and compressed class space
- JIT-compiled code cache
- Thread stacks
- Direct and memory-mapped buffers
- JNI and other native allocations
- GC bookkeeping
- Shared libraries and the JVM itself
The Linux kernel enforces the cgroup limit on the whole process and its memory, not on Java heap alone. When total usage crosses the limit, the kernel can kill the process. The JVM may never have an opportunity to throw OutOfMemoryError or write a heap dump.
| Failure signal | Likely mechanism | First evidence to collect |
|---|---|---|
Container exits with code 137 or OOMKilled |
Cgroup memory limit exceeded | Pod/task stop reason, kernel or node events, total RSS |
Java throws OutOfMemoryError: Java heap space |
Heap exhausted inside a still-running cgroup | GC log, heap occupancy, allocation profile |
OutOfMemoryError: Metaspace |
Class metadata limit or leak | Native memory tracking and classloader count |
| Latency spikes with low CPU utilization | CFS throttling or too many JVM worker threads | Throttled seconds, runnable threads, detected processors |
ClassNotFoundException after host update |
Wildcard classpath ordering changed | Exact runtime classpath and duplicate classes |
Don’t raise the container limit until you know which row applies. More memory can hide a direct-buffer leak for a week and make the next failure more expensive.
Verify what the JVM sees before tuning it
Modern Java releases enable UseContainerSupport by default, but old patch levels and inherited startup flags still cause surprises. Cgroup v2 support arrived in JDK 15 and was backported to JDK 11.0.16 and JDK 8u372. A JVM older than those backports can read host memory instead of the container limit on a cgroup v2 host.
Run the same image with the same limits as production and ask Java what it detected:
java -XshowSettings:system -version 2>&1
java -XshowSettings:vm -version 2>&1
java -XX:+PrintFlagsFinal -version 2>&1 \
  | grep -E 'UseContainerSupport|MaxRAMPercentage|InitialRAMPercentage|ActiveProcessorCount'
For JDK 8 or 11, -XshowSettings:all may expose more useful detail. Compare the reported memory and processor count with the task or Pod definition. If an 8 GiB container reports a 64 GiB host, stop. Upgrade the JDK or remove the flag that disabled container support before tuning percentages.
An old JVM with a default maximum heap near 25% can read 64 GiB and choose about 16 GiB of heap inside an 8 GiB container. The kernel kills it long before the JVM reaches its own calculated ceiling. That failure is not a garbage-collector problem.
The AWS Java container best-practices article documents these version thresholds and detection commands. Pin the JDK patch release in the image; 17 is not a reproducible version.
Size heap from measured native overhead
MaxRAMPercentage=75 is a starting point, not a law. A Spring service with ordinary HTTP traffic may fit comfortably. A Netty service with large direct buffers, thousands of threads, or JNI libraries may need 60–70%. A small container can need an even lower heap share because fixed JVM overhead occupies a larger percentage.
Start with this production-safe shape:
JAVA_TOOL_OPTIONS=
  -XX:+UseContainerSupport
  -XX:MaxRAMPercentage=70.0
  -XX:InitialRAMPercentage=40.0
  -XX:+ExitOnOutOfMemoryError
  -Xlog:os+container=info,gc*=info:file=/tmp/jvm-gc.log:time,level,tags
JAVA_TOOL_OPTIONS affects tools launched in the container as well as the server. If that is undesirable, pass flags directly to the application command. Do not put heap dumps in /tmp without sizing ephemeral storage and exporting the dump. A multi-gigabyte dump can fill the container filesystem and create a second failure.
Use Native Memory Tracking in a diagnostic environment:
java -XX:NativeMemoryTracking=summary -jar app.jar

# From another process in the same container or via an approved debug path:
jcmd 1 VM.native_memory summary
NMT has overhead, so measure before enabling detail mode in production. Combine it with RSS, heap, direct buffer, thread count, and cgroup working-set metrics. The CloudWatch Container Insights guide for EKS shows how to establish the infrastructure side of that view.
ECS task definition that matches JVM intent
On Fargate, task-level CPU and memory are mandatory and must use supported combinations. The current ECS table ranges from 0.25 vCPU with 512 MiB–2 GiB through larger shapes, including 32 vCPU with selected memory values. Read the Fargate task-definition matrix rather than assuming every CPU/memory pair is valid.
This example gives one Java container 1 vCPU and 2 GiB:
{
  "family": "catalog-java",
  "networkMode": "awsvpc",
  "requiresCompatibilities": ["FARGATE"],
  "cpu": "1024",
  "memory": "2048",
  "containerDefinitions": [
    {
      "name": "catalog",
      "image": "111122223333.dkr.ecr.us-east-1.amazonaws.com/catalog:2026.07.30",
      "essential": true,
      "cpu": 1024,
      "memory": 2048,
      "environment": [
        {
          "name": "JAVA_TOOL_OPTIONS",
          "value": "-XX:MaxRAMPercentage=70.0 -XX:InitialRAMPercentage=40.0 -XX:ActiveProcessorCount=1 -XX:+ExitOnOutOfMemoryError"
        }
      ],
      "healthCheck": {
        "command": ["CMD-SHELL", "curl -fsS http://localhost:8080/actuator/health/readiness || exit 1"],
        "interval": 15,
        "timeout": 5,
        "retries": 3,
        "startPeriod": 60
      }
    }
  ]
}
The explicit ActiveProcessorCount=1 prevents JVM subsystems and frameworks from sizing thread pools from a larger visible processor set. Verify that one is correct for your task; don’t copy it into a 4-vCPU definition. Also inspect application pools. Netty, ForkJoinPool, database clients, and garbage collectors can each derive concurrency independently.
ECS on EC2 has different isolation behavior from Fargate. CPU shares and host contention matter, and one task can see host topology that does not match its guaranteed share. The ECS and EKS container decision framework helps choose the platform boundary, while the resource test remains the same: compare what Java sees with what the orchestrator promised.
EKS resources that don’t invite throttling
Kubernetes uses the CPU request for scheduling and typically as a proportional share during contention. A CPU limit is enforced through throttling. Memory limits are reactive: the kernel kills processes when memory pressure crosses the cgroup boundary.
apiVersion: apps/v1
kind: Deployment
metadata:
  name: catalog-java
spec:
  replicas: 3
  selector:
    matchLabels:
      app: catalog-java
  template:
    metadata:
      labels:
        app: catalog-java
    spec:
      containers:
        - name: catalog
          image: 111122223333.dkr.ecr.us-east-1.amazonaws.com/catalog:2026.07.30
          env:
            - name: JAVA_TOOL_OPTIONS
              value: >-
                -XX:MaxRAMPercentage=70.0
                -XX:InitialRAMPercentage=40.0
                -XX:ActiveProcessorCount=1
                -XX:+ExitOnOutOfMemoryError
          resources:
            requests:
              cpu: "750m"
              memory: "1536Mi"
            limits:
              cpu: "1"
              memory: "2Gi"
          readinessProbe:
            httpGet:
              path: /actuator/health/readiness
              port: 8080
            initialDelaySeconds: 15
            periodSeconds: 10
The Kubernetes resource management documentation distinguishes requests from limits and defines CPU units precisely. 500m means half a CPU. In a memory field, 400m means 0.4 bytes, not 400 MiB. Use Mi or Gi and catch unit mistakes in policy.
CPU limits are contentious for latency-sensitive Java. A service may burst during garbage collection or JIT compilation, hit the quota, and suffer tail latency even though average CPU is low. Test three configurations under representative load: request equals limit, request below limit, and no CPU limit with a carefully chosen request. Your cluster policy and tenancy model decide which is acceptable.
The Kubernetes 1.36 resource-management guide covers newer Pod-level controls and in-place resizing. A resize does not guarantee that every JVM recalculates its ergonomics. Explicit processor and memory flags make the process behavior predictable across a resize.
Diagnose CPU throttling from both sides
Java exposes process and GC behavior; the cgroup exposes enforcement. Collect both.
Inside a cgroup v2 container:
cat /sys/fs/cgroup/cpu.max
cat /sys/fs/cgroup/cpu.stat
cat /sys/fs/cgroup/memory.max
cat /sys/fs/cgroup/memory.current
cat /sys/fs/cgroup/memory.events
cpu.stat includes throttling counters. memory.events can expose oom and oom_kill. Paths differ on cgroup v1 and some hardened images do not include debugging tools, so capture through a controlled ephemeral container or node telemetry rather than expanding the production image casually.
At the application layer, graph request rate, p50/p95/p99 latency, GC pause time, allocation rate, runnable threads, connection pool wait, and compilation activity. A latency spike synchronized with nr_throttled is different from one synchronized with database wait.
| Pattern | Interpretation | Likely action |
|---|---|---|
| High throttling, high runnable threads, low host saturation | Container CPU quota is tight or thread pools are oversized | Raise limit or reduce concurrency after load test |
| No throttling, long GC pauses, heap near ceiling | Heap/GC tuning or allocation issue | Profile allocations and collector behavior |
| RSS near limit, heap well below ceiling | Native memory, stacks, buffers, or mappings | Lower heap share and inspect NMT/direct buffers |
| OOM events with no JVM error | Kernel killed process | Preserve cgroup and orchestrator evidence |
| CPU rises after architecture migration | JDK or native dependency mismatch | Validate image and JIT on target architecture |
If you are moving Java to ARM, pair this work with the AWS Graviton migration guide. A multi-architecture tag does not prove every JNI library is available or optimized for both architectures.
Make the classpath deterministic
The Java launcher accepts wildcard classpaths such as lib/*. The order of JAR expansion is not a dependency-resolution guarantee. If two JARs contain the same class or incompatible versions of a package, whichever appears first wins. Filesystem directory enumeration can change after a base-image or host-kernel update even when the application layer is identical.
This is fragile:
ENTRYPOINT ["java", "-cp", "app.jar:lib/*", "com.example.Main"]
Prefer an executable JAR produced by the build tool, a runtime image assembled by jlink, or an explicit classpath file generated during the build. At minimum, detect duplicates and store the resolved classpath as a build artifact.
For Maven, copy runtime dependencies and list them deterministically:
mvn -B -DskipTests dependency:copy-dependencies \
  -DincludeScope=runtime \
  -DoutputDirectory=target/dependency

find target/dependency -maxdepth 1 -type f -name '*.jar' \
  -printf '%f\n' | LC_ALL=C sort > target/classpath.order
Then generate the classpath from that sorted list at build time, not from the live directory at startup. Better still, use the framework’s supported packaging format and fail the build on dependency convergence errors.
Scan for duplicate classes with tools such as Maven Enforcer, Gradle dependency insight, jdeps, or a dedicated duplicate-finder plugin. A ClassNotFoundException is not the only symptom; NoSuchMethodError, LinkageError, and silent selection of an old provider are common.
A multi-stage Docker build keeps Maven or Gradle out of the runtime image and lets you pin both build and runtime JDK digests. Do not use amazoncorretto:21 without a digest or patch policy and call the result reproducible.
Build a regression test for container ergonomics
Add a pipeline stage that runs the actual image with production-like limits:
docker run --rm \
  --memory=2g \
  --cpus=1 \
  --entrypoint java \
  catalog:candidate \
  -XshowSettings:system -XshowSettings:vm -version 2>&1 \
  | tee jvm-container-settings.txt
Fail if the output does not report the expected provider, memory ceiling, or processor count. Then start the application and run a short allocation and concurrency test. This will not replace production load testing, but it catches a disabled UseContainerSupport, an ancient JDK, and an accidental 16-core thread-pool assumption before deployment.
Also compare the generated dependency graph and classpath order with the previous release. A host update should not select a different class from an unchanged image. If it does, the package was never deterministic.
A practical sizing loop
Start from a measured peak, not a percentage copied from another service. Under representative load, collect maximum heap after GC, metaspace, code cache, direct buffers, thread stacks, and other native memory. Add headroom for bursts and diagnostics. Choose the container limit, then derive a heap percentage that leaves that native headroom.
Load-test with the exact JDK patch, base-image digest, CPU limit, memory limit, and architecture. Observe tail latency and throttling, not just throughput. Repeat after significant framework, JDK, or collector changes.
Use ECS/Fargate when you want a smaller operational surface and AWS-native task isolation. Use EKS when Kubernetes APIs, scheduling, policy, or ecosystem integrations justify the control plane. The JVM flags should travel with the workload, but the telemetry and disruption behavior differ.
The key is to make four numbers agree: orchestrator memory, JVM-detected memory, maximum heap, and measured total RSS. Do the same for CPU: requested CPU, enforced quota, JVM processor count, and application concurrency. When those inputs are explicit, Java container failures stop looking random. They become ordinary capacity and packaging bugs, which is a much better class of problem to own.
Build a repeatable container-sizing experiment
Heap percentage is a starting hypothesis, not a capacity answer. Build a load experiment that measures the whole process under the same image, runtime flags, resource limit, traffic shape, and dependency behavior used in production.
At startup, capture the container limits and the JVM’s interpretation:
java -XshowSettings:system -XshowSettings:vm -version
Record Operating System Metrics, effective processor count, maximum heap, JVM version, garbage collector, classpath, and all explicit flags. If the reported processor or memory limits disagree with the task definition or Pod specification, stop before tuning application code. Confirm the JDK contains the cgroup fixes required for the host’s cgroup version.
During a stepped load test, collect:
- Resident set size and container working set
- Heap used, committed, and maximum
- Metaspace and compressed class space
- Direct and mapped buffer pools
- Thread count and per-thread stack reservation
- Garbage collection pause, frequency, allocation, and promotion rate
- JIT code cache and compilation activity
- CPU throttling, run-queue pressure, and throttled periods
- Container OOM events, exit code, and Kubernetes restart reason or ECS stop reason
- Application throughput, p50/p95/p99 latency, and errors
Hold a stage long enough to reach steady state. A five-minute test may miss class loading, cache growth, direct-buffer retention, or a slow leak. Include startup bursts, traffic spikes, dependency timeouts, and graceful shutdown.
Use a memory budget rather than assigning the entire limit to the heap:
container limit
  = Java heap
  + metaspace
  + thread stacks
  + direct and mapped buffers
  + JIT/code cache
  + native libraries and allocator overhead
  + monitoring agent
  + safety margin
If an 8 GiB container uses a 60 percent maximum heap, the nominal heap is about 4.8 GiB, leaving roughly 3.2 GiB for every non-heap component and safety margin. Whether that is generous or insufficient depends on thread count, networking libraries, JNI, observability agents, and allocator behavior. Verify it empirically.
Diagnose the signal before changing the flag
An OOMKilled container does not prove the Java heap was too large, and a long GC pause does not prove the container needs more memory.
| Symptom | Likely investigation | Avoid this reflex |
|---|---|---|
| Container OOMKill while heap is below max | Native memory, direct buffers, thread stacks, sidecars | Increase heap percentage |
| Frequent full GC near max heap | Live-set growth, allocation pattern, leak, undersizing | Add CPU only |
| High CPU throttling with modest JVM CPU | Cgroup quota and task/Pod CPU limit | Change garbage collector first |
| JVM sees many processors and creates too many workers | JDK container support and ActiveProcessorCount |
Reduce every library pool independently |
| Good average latency, poor p99 | GC pauses, throttling, dependency queues | Scale solely from average CPU |
| Different behavior after image change | JDK patch, base image, agents, classpath order | Assume application commit caused it |
Use Native Memory Tracking in a controlled environment when unexplained native growth remains. It has overhead, so enable it deliberately, capture baselines and diffs, and avoid leaving expensive diagnostics on blindly.
On Kubernetes, compare memory request, memory limit, node pressure, QoS class, and eviction events. On Fargate, choose a valid task CPU/memory combination first, then budget containers inside it. The task-level allocation and Java container limit must agree; otherwise the JVM may size against a different boundary than the one the operator intended.
Promote a sizing change only when it improves both runtime health and application SLOs under repeated tests. Roll it out with a small canary and compare normalized metrics per request. Document the JDK version and flags with the result so a base-image update does not silently invalidate the experiment.
Keep the diagnostic command and load profile beside the service code. Re-run them after JDK, base-image, observability-agent, garbage-collector, or Fargate sizing changes; each can alter the effective memory or CPU boundary without changing application source.
Sources
- AWS Containers Blog: JVM memory, CPU, and classpath best practices
- Amazon ECS: Fargate task-definition differences
- Amazon ECS: Task and container security best practices
- Kubernetes: Resource management for Pods and containers
- OpenJDK: Container awareness enhancement
- OpenJDK: cgroups v2 support
- Oracle Java launcher documentation
Explore more like this

Cloud IoT Security: Zero Trust, Identity, and Signed Updates
On September 11, 2026, the Cyber Resilience Act’s incident-reporting rules start applying in the European Union. That is 22 days after this article’s publication date. A manufacturer that learns of...

Kill the Docker Hub Token: OIDC Trust for GitHub Actions
On July 31, 2026, Docker shipped OIDC connections for GitHub Actions to any organization on a Docker Team, Docker Business, or Docker Hardened Images subscription, plus organizations in the Docker-Sponsored...

Bedrock Web Search: Grounding an Agent Without Building a Scraper
On August 4, 2026, AWS made Web Search on Amazon Bedrock generally available, and the entire integration surface is one JSON object: {"type": "web_search"}. That is the whole change from...

Comments