
AWS Glue Data Quality Anomaly Detection for Catalog Tables

AWS Glue Data Quality gained two important capabilities on July 27, 2026: anomaly detection now works for Catalog-based data quality evaluations, and evaluation results can be written into AWS Glue Data Catalog tables. Data engineers can detect an unexpected row-count spike or a sudden drop in distinct values without hard-coding a threshold, then query rule outcomes, profiling metrics, forecasts, and confidence bounds with SQL. The existing Glue ETL guide explains the surrounding catalog and transformation workflow; this guide concentrates on operating the quality signal.
This closes an awkward gap. Glue ETL jobs already had ML-powered anomaly detection, but teams monitoring hundreds of cataloged tables either wrote static DQDL rules, built their own metric history, or moved the evaluation into an ETL job. The new path lets governance and data-platform teams evaluate data where it is cataloged and retain a queryable history without inventing a second quality database. Teams exposing that history through Athena can use the Athena versus Redshift Spectrum comparison to choose the query path. If the downstream warehouse is Redshift, the Amazon Redshift guide provides the broader operating context.
It does not make rules obsolete. A negative payment amount is invalid even if negative amounts appeared yesterday. A 35% traffic increase may be correct during a campaign even if it breaks a static row-count limit. Production data quality needs both: deterministic rules for known invariants and anomaly detection for changing behavior.
What changed
AWS Glue Data Quality has two entry points:
- Data Catalog evaluations run against tables registered in the Glue Data Catalog. They suit data stewards, analysts, governance teams, and scheduled checks independent of an ETL transformation.
- Glue ETL evaluations run inside data pipelines and can identify failing records, stop or route bad data, and use job context.
The July 2026 announcement makes anomaly detection consistent across those entry points and lets both write history to Data Catalog tables.
| Capability | Catalog evaluation | ETL job evaluation |
|---|---|---|
| Evaluate cataloged S3, Redshift, JDBC, Iceberg, Hudi, or Delta sources | Yes, subject to source limits | Through Glue connectors and job inputs |
| Author DQDL rules | Yes | Yes |
| ML anomaly detection | Added for Catalog evaluations in July 2026 | Existing capability |
| Identify individual failed records | Not the primary Catalog mode | Supported in ETL flows |
| Schedule checks | Native evaluation schedules and orchestration | Glue workflow or Step Functions |
| Write outcomes and forecasts to Data Catalog tables | Added in July 2026 | Added as a consistent results path |
| Query history with SQL | Yes, after results-table configuration | Yes, after results-table configuration |
The source-compatibility details can change. Use the current Glue Data Quality documentation before promising support for a specific table format or view type.
Rules, analyzers, statistics, and observations
The vocabulary is easy to blur:
- A rule evaluates a condition and returns true or false.
Completeness "customer_id" > 0.99is a rule. - An analyzer calculates a statistic such as row count or distinct-value count. It does not need a hard threshold.
- A statistic is the measured value from one run.
- An observation is an unconfirmed insight generated from historical statistics.
- An anomaly occurs when an actual statistic falls outside the expected range calculated from history.
Rules answer, “Did this dataset meet a declared contract?” Analyzers answer, “What happened?” The forecast answers, “Is what happened unusual for this series?”
The basic DQDL structure looks like this:
Rules = [
    Completeness "order_id" > 0.999,
    Uniqueness "order_id" > 0.999,
    ColumnValues "order_total" >= 0,
    IsComplete "event_time",
    DetectAnomalies "RowCount"
]

Analyzers = [
    RowCount,
    DistinctValuesCount "customer_id",
    Mean "order_total",
    Completeness "shipping_postal_code"
]
DetectAnomalies "RowCount" is useful because it turns the statistical signal into a rule outcome. AWS’s anomaly-detection example shows an important gotcha: an observed anomaly can exist while the data-quality score remains 100% if no rule fails. Add a DetectAnomalies rule when the anomaly should influence pass/fail behavior. Keep some analyzers observational when a human should review the signal before it blocks data.
The DQDL reference is the source of truth for analyzer and rule syntax. Validate the ruleset through the console or API before committing it to automation; similar-looking analyzers do not all take identical arguments.
How the anomaly loop works
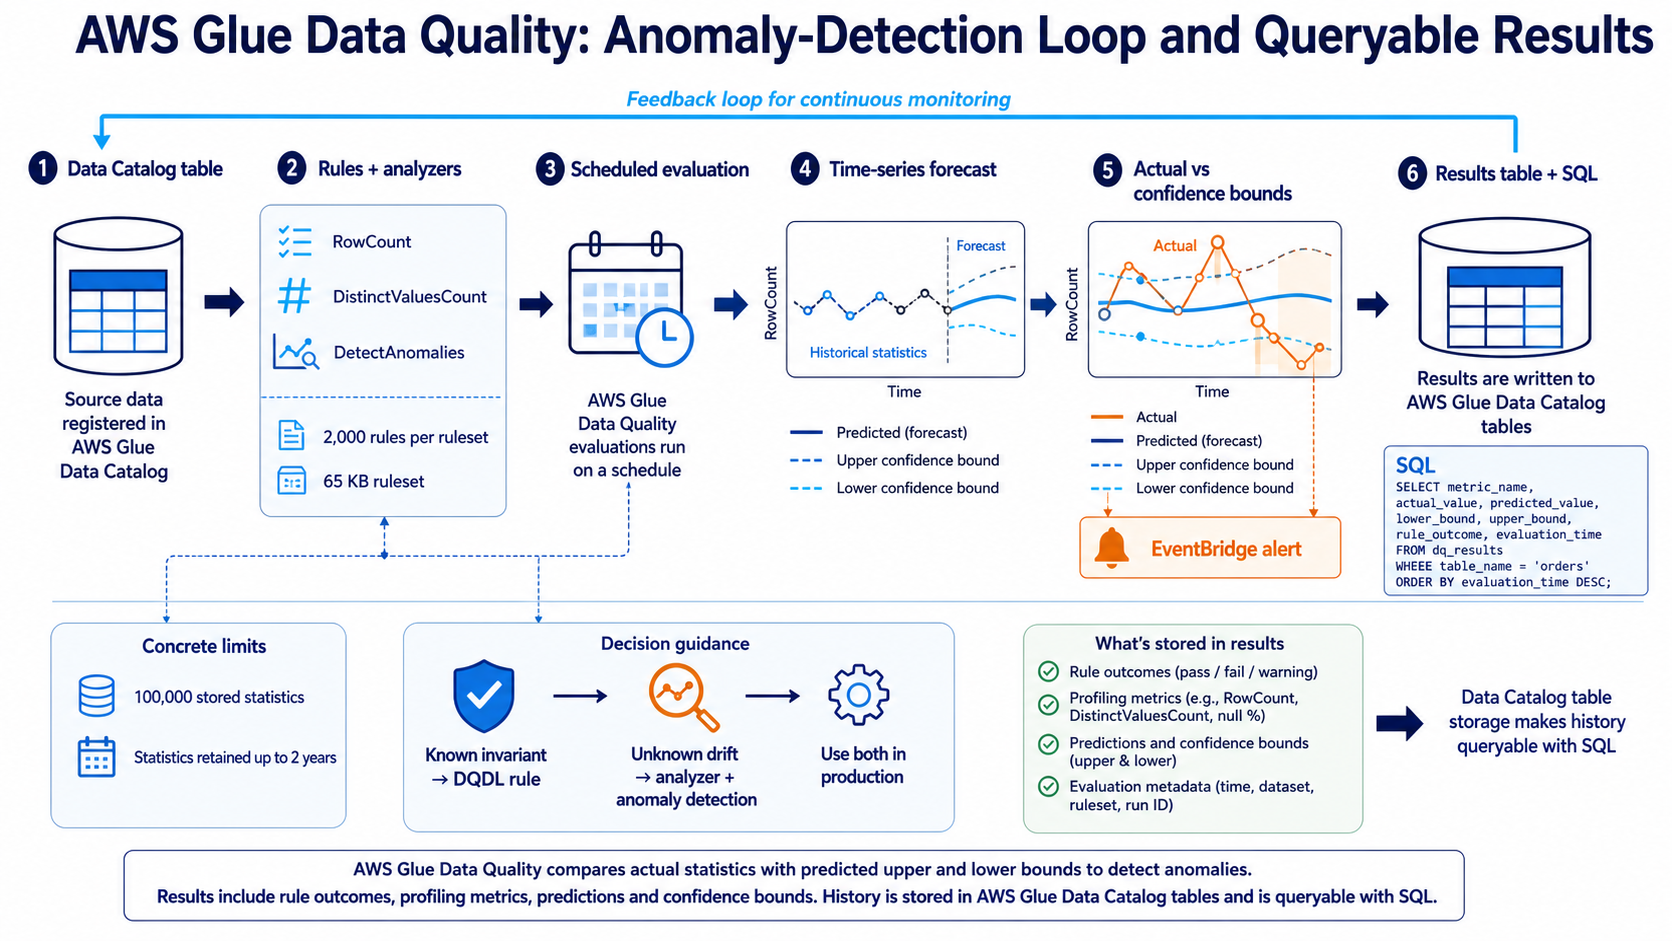
Glue collects statistics on repeated evaluation runs. The model builds an expected time-series range, including upper and lower confidence bounds. A later actual value outside that range becomes an anomaly.
AWS’s published walkthrough uses three historical runs to predict the fourth. That is enough to demonstrate the mechanism, not enough to learn a complex business cycle. Daily traffic may differ on weekends. Monthly billing tables spike near close. A holiday moves every year. Give the model representative history before treating every observation as an incident.
The review loop matters. In the Glue console, an operator can inspect the actual value, prediction, upper and lower bounds, and trend. The operator can exclude an anomalous point from future training. If an outage cut the row count in half, you probably do not want that failure teaching the model that half volume is normal.
The anomaly-view documentation notes another subtlety: when you change training inputs on older points, the updated model is reflected in the latest run. Treat analyst feedback as a controlled operation and record who excluded a point and why.
Choose metrics that reflect failure
Monitoring every available statistic creates noise. Start from how a bad dataset harms a consumer.
| Failure mode | Rule or analyzer | Why it works | Common false positive |
|---|---|---|---|
| Source stopped sending data | RowCount plus anomaly detection |
Detects sudden volume loss | Planned source pause |
| Duplicate ingest | Uniqueness rule and RowCount analyzer |
Catches repeated keys and volume spike | Legitimate replay into a new partition |
| Dimension collapsed | DistinctValuesCount analyzer |
Detects loss of category diversity | New filter or product sunset |
| Nulls increased | Completeness rule/analyzer |
Measures required-field population | Optional field removed by design |
| Amount distribution shifted | Mean or other distribution statistic | Surfaces upstream unit or currency change | Real promotion or seasonality |
| Data arrived late | Freshness rule | Encodes time contract directly | Approved maintenance window |
Use a deterministic DQDL rule for a business invariant. order_total >= 0 should not adapt to history. Use an analyzer and anomaly model when the healthy value changes over time. Use both when a hard floor exists but drift within the valid range still deserves investigation.
If you are new to the service, the AWS Glue ETL guide explains crawlers, Data Catalog tables, Spark jobs, partitions, and job bookmarks. Data quality is much easier to operate when table ownership and ingestion boundaries already exist.
Configure a Catalog evaluation
The console is the fastest way to learn the workflow:
- Open AWS Glue and select a Data Catalog table.
- Open the Data quality tab and create or select a ruleset.
- Add deterministic rules and analyzers for the metrics you want to learn.
- Enable anomaly detection for the Catalog evaluation.
- Configure a schedule and an IAM role that can read the source, run the evaluation, publish observability data, and write the selected results table.
- Configure results storage in an AWS Glue Data Catalog table.
- Run enough baseline evaluations to establish history.
- Review anomalies, prediction bounds, and result-table rows before attaching paging alerts.
For infrastructure as code, Glue supports CloudFormation resources for data-quality rulesets. A minimal ruleset resource looks like this:
Resources:
  OrdersQualityRuleset:
    Type: AWS::Glue::DataQualityRuleset
    Properties:
      Name: orders-quality-prod
      Description: Contracts and anomaly signals for the orders table
      TargetTable:
        DatabaseName: commerce_prod
        TableName: orders
      Ruleset: |
        Rules = [
          Completeness "order_id" > 0.999,
          Uniqueness "order_id" > 0.999,
          ColumnValues "order_total" >= 0,
          DetectAnomalies "RowCount"
        ]
        Analyzers = [
          RowCount,
          DistinctValuesCount "customer_id",
          Mean "order_total"
        ]
CloudFormation property support can lag a just-launched console or API feature. Check the current CloudFormation resource reference for anomaly and results-table configuration. If a new field is not supported yet, manage that narrow setting with an SDK-backed custom resource or a controlled post-deploy step rather than hiding the whole ruleset in an imperative script.
Store results as queryable data
Before this launch, teams often sent results to S3, CloudWatch, or a custom database. Those remain useful. Data Catalog table output creates a shared SQL-accessible history for analysts, data-product owners, and dashboards.
The announcement says the stored data includes:
- rule outcomes;
- profiling metrics;
- anomaly predictions;
- confidence bounds;
- results from ETL and Catalog evaluations.
Do not assume a column schema from a screenshot or blog example. Let Glue create or document the result shape, inspect it with DESCRIBE, and then build a stable view for consumers. A raw results table can evolve; a versioned view gives dashboards a contract.
-- Inspect the table Glue configured before building downstream queries.
DESCRIBE glue_quality_results;

-- Replace these placeholder names with the actual generated schema.
CREATE OR REPLACE VIEW quality_latest AS
SELECT *
FROM glue_quality_results
WHERE evaluation_time >= current_timestamp - INTERVAL '7' DAY;
That cautious approach prevents a dangerous kind of documentation: SQL that looks executable but targets invented field names.
Partition the results table if the generated integration supports it or create a derived table optimized for time, database, table, and ruleset. Retain enough history for seasonality and audit, but don’t keep high-cardinality metrics forever without a reason.
The new output is a strong fit for S3 Tables and Iceberg-based analytics. The Amazon S3 Tables and Apache Iceberg guide explains compaction, snapshots, schema evolution, and managed table operations that matter once quality history becomes a shared dataset.
Alert without paging on every surprise
AWS Glue Data Quality integrates with EventBridge and CloudWatch. Use EventBridge to route evaluation state and rule outcomes into an operational workflow. Use the SQL history for trends, governance reports, and retrospective analysis.
Start with tiered response:
| Condition | Response |
|---|---|
| Hard contract fails on a critical table | Page or stop downstream publication |
| One anomaly on a non-critical analyzer | Create a review item |
| Same anomaly repeats across several runs | Escalate to the owning team |
| Multiple related metrics move together | Open an incident with context |
| Baseline change is approved | Exclude or retrain with an audit note |
An anomaly is evidence, not automatically an outage. Row count can spike because the business grew. Distinct customers can fall because a campaign ended. Page when the signal and business impact justify interruption.
The orchestration patterns in EventBridge and Step Functions work well for controlled handling: receive the event, enrich it with table ownership, branch by severity, request approval for quarantining, and record the outcome. Avoid a Lambda that blindly deletes a partition whenever a metric crosses a learned bound.
Data contracts and ownership
A quality rule without an owner becomes background noise. Every monitored table needs:
- a data-product owner;
- a technical on-call or support queue;
- a freshness expectation;
- a schema contract;
- critical consumer list;
- response policy for failed rules and anomalies;
- a process for approved baseline changes.
Put ownership in Data Catalog metadata or your data-governance system and copy it into alerts. “Table orders_v4 has a RowCount anomaly” is weak. “The commerce orders product is 42% below its Tuesday confidence band; finance close and fulfillment dashboards depend on it; owner is Data Platform Orders” is actionable.
Labels in DQDL help organize rules by domain, team, or risk class. The AWS guide to DQDL labels shows how to build reporting slices without encoding organization structure in rule names.
Limits and scaling design
The current Glue Data Quality documentation lists these service limits:
- 2,000 rules per ruleset;
- 65 KB maximum ruleset size;
- 100,000 stored statistics per account;
- statistics retained for a maximum of two years.
The 100,000-statistic limit is easy to ignore. A statistic is collected for each rule or analyzer over runs. Hundreds of tables, dozens of analyzers, and hourly schedules can consume the account pool quickly.
Estimate before enabling everything:
statistics per year ≈ tables × metrics per table × runs per day × 365
One hundred tables with ten metrics evaluated daily produce about 365,000 observations over a year. The service limit describes stored statistics, and retention/rollup behavior affects the actual count, but the estimate proves that an unbounded “monitor every metric” plan needs validation. Start with business-critical metrics, monitor usage, and request guidance or quota changes where available.
Split rulesets by table and concern when ownership differs. A monolithic 2,000-rule file is technically allowed and operationally painful. Smaller rulesets give cleaner deployments, alerts, and audit trails.
Security and cost controls
The evaluation role reads production data. Scope it to the required Data Catalog tables, source locations, KMS keys, and results destination. Lake Formation permissions still apply where used. Do not solve an access failure with broad S3 read across the data lake.
The results themselves may be sensitive. Column names, completeness rates, data-source identifiers, and anomaly timing can reveal business activity. Encrypt the storage, restrict queries, log access, and apply retention.
Glue Data Quality pricing depends on the evaluation mode and processing consumed. Use the current AWS Glue pricing page and measure a representative ruleset. Reduce waste by matching schedule to business need, applying partition predicates or incremental patterns, and avoiding duplicate evaluation in both ETL and Catalog layers unless each serves a distinct control.
Common mistakes
Turning every analyzer into a blocking rule. This converts normal business variation into pipeline outages. Start observational, then promote a mature signal when the response is understood.
Training on known incidents. If a broken source becomes part of the baseline, the model can learn failure as normal. Review and exclude confirmed bad points.
Using anomaly detection for invariants. A negative price is invalid regardless of trend. Keep hard contracts hard.
Alerting before ownership exists. An event with no responsible team is noise. Add ownership first.
Assuming a 100% score means no anomaly. Observations can exist without a failed rule. Add DetectAnomalies only where anomaly status should affect the score.
Querying raw results forever. Put a stable view or curated table between evolving service output and executive dashboards.
When to use Catalog anomaly detection
Use it when tables are already registered in Glue, data quality must be monitored outside a specific ETL job, thresholds change with business patterns, and several teams need SQL-accessible history.
Keep evaluation in the ETL job when you need record-level failure handling before publishing data. Use both when the ETL layer enforces immediate contracts and the Catalog layer provides independent product-level monitoring across pipelines.
Use another platform when your quality estate spans clouds and engines that Glue cannot read economically, or when you need a vendor-neutral data-contract control plane. The right design is the one that closes the feedback loop from detection to owner to remediation, not the one with the most metrics.
Catalog anomaly detection is valuable because it moves the baseline closer to the data product and makes the history queryable. Pair it with deterministic rules, careful training feedback, and owned response paths. Then a confidence bound becomes a useful engineering signal instead of another chart nobody trusts.
Worked design: an hourly orders table
Assume an orders table receives one partition per hour. Finance needs non-negative totals and unique order IDs. Fulfillment needs data within 30 minutes. The business volume changes by hour and day, so a fixed row-count range would page during every campaign.
Create deterministic rules for order_id completeness and uniqueness, non-negative order_total, schema, and freshness. Add analyzers for row count, distinct customers, mean order value, and completeness of the optional shipping field. Turn on anomaly detection for row count and distinct customers, but leave those signals observational for the first month.
Run the evaluation after the partition is expected to land, not at the top of the hour while ingestion is still active. Write results to the Data Catalog table and send failed hard rules to EventBridge immediately. Send anomalies to a lower-urgency review queue until the team understands their precision.
During week one, the model flags a Friday evening volume spike. The data owner confirms a promotion and keeps the point in training. During week two, row count falls 70% while distinct customers and order value also fall. The combination is more credible than one metric. The on-call finds a source connector retry loop and marks the failed point for exclusion from future training.
After four weeks, the team reviews outcomes. Row-count anomalies correctly found two incidents but also flagged predictable month-end behavior. They keep anomaly detection, add a label such as domain:commerce, and document month-end review rather than widening a static threshold. The freshness rule remains blocking because late data is always a contract violation.
Build two SQL consumers from the result history. The operations view shows the latest run per critical table, failed rules, active anomalies, owner, and ticket. The governance view reports weekly pass rate, recurring metrics, mean time to acknowledge, and rulesets without owners. Neither dashboard queries the raw service table directly; a versioned view translates the generated schema into stable fields.
This pattern scales because it separates three questions. Contracts decide whether data is allowed to publish. Anomaly models decide whether behavior deserves attention. Ownership decides what happens next. Putting all three into one pass percentage hides the information people need.
Trusted resources
- Catalog anomaly detection and result-table announcement
- AWS Glue Data Quality overview and limits
- Data Quality Definition Language reference
- Viewing scores, forecasts, and anomalies
- Configuring anomaly detection in Glue ETL
- AWS anomaly-detection implementation walkthrough
- AWS Glue Data Quality troubleshooting
- AWS Glue pricing
Explore more like this

Cloud IoT Security: Zero Trust, Identity, and Signed Updates
On September 11, 2026, the Cyber Resilience Act’s incident-reporting rules start applying in the European Union. That is 22 days after this article’s publication date. A manufacturer that learns of...

Bedrock Web Search: Grounding an Agent Without Building a Scraper
On August 4, 2026, AWS made Web Search on Amazon Bedrock generally available, and the entire integration surface is one JSON object: {"type": "web_search"}. That is the whole change from...

ECR Now Allows 200 GB Image Layers. Your Model Weights Still Do Not Belong There
On August 3, 2026, AWS raised the maximum Amazon ECR image layer size to 200 GB for images pushed with docker push. The announcement names the driver in the second...

Comments