
SageMaker Inference Meta-Monitoring with Amazon Quick: Fleet Governance

A SageMaker endpoint can be healthy while its predictions are getting worse. CPU, latency, and 5xx alarms prove that inference runs. They do not prove that fraud recall, credit decisions, or demand forecasts still match reality.
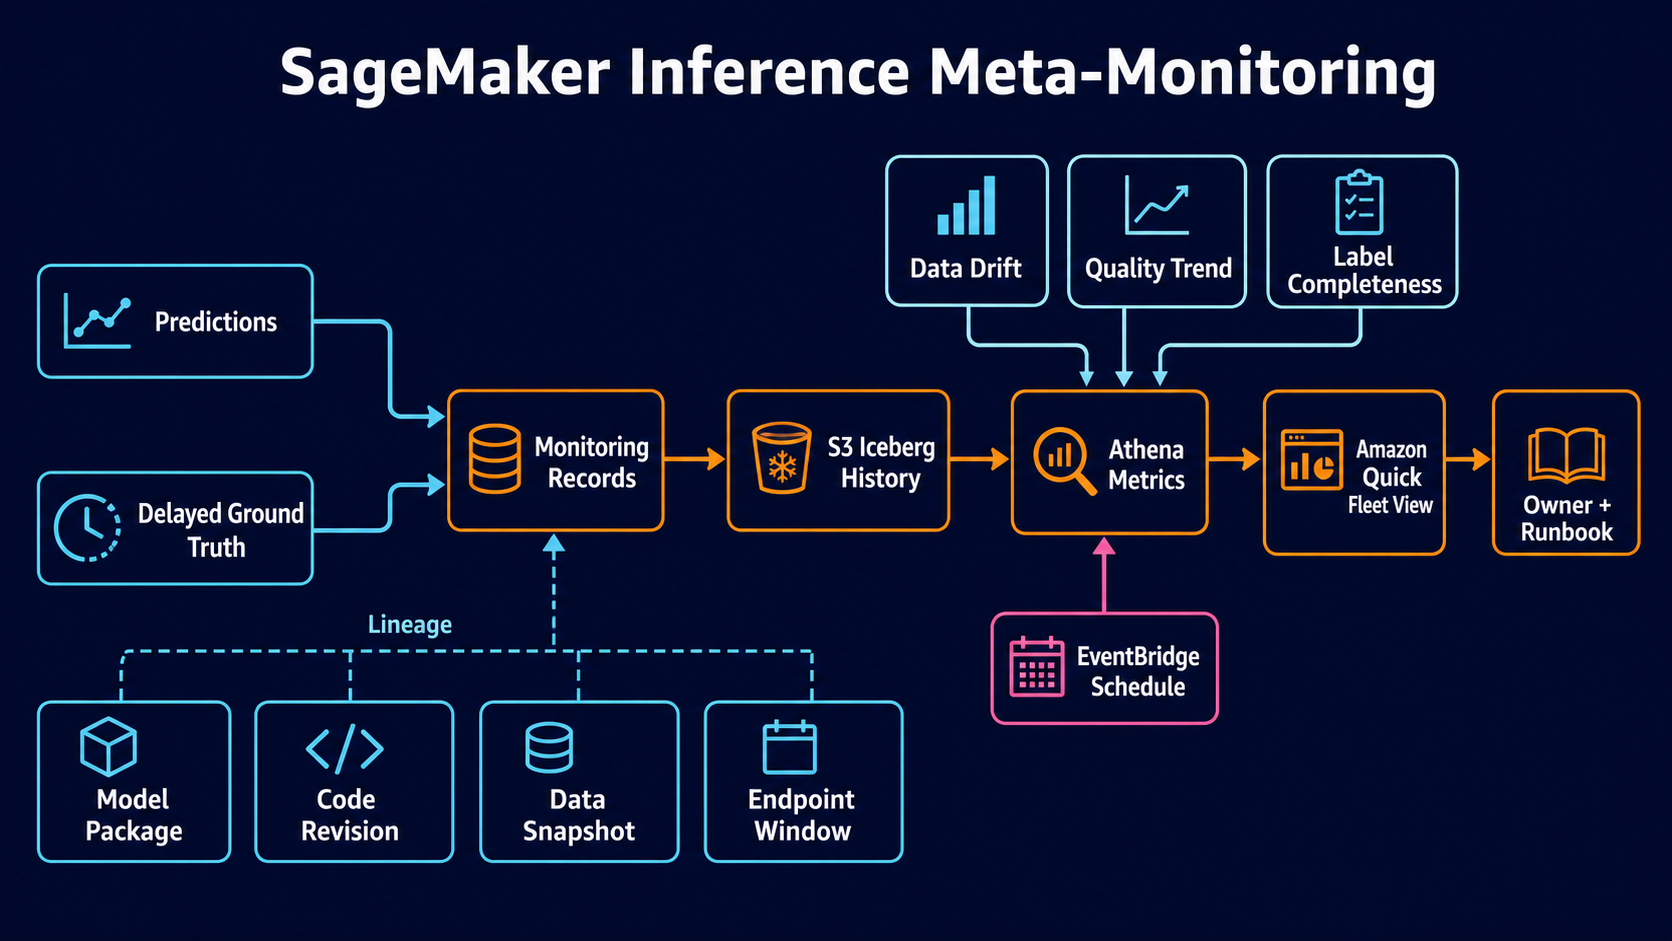
AWS published an inference meta-monitoring architecture on July 30, 2026 that sits above individual SageMaker AI endpoints. It joins inference records with delayed ground truth, computes data and model drift, stores versioned results in Athena Iceberg tables, and presents fleet trends in Amazon Quick. SageMaker MLflow Apps can add experiment and model lineage.
The useful part is not the dashboard. It is the lineage contract: every deployed model carries a frozen baseline that identifies the exact training and evaluation snapshots plus the code commit that produced it. Monitoring resolves the model currently served, loads that baseline, and compares production against the correct version. That prevents a common failure in homegrown systems: a beautiful chart comparing today’s endpoint with last quarter’s unrelated baseline.
This guide turns the sample into a production governance layer. It covers event capture, delayed labels, Iceberg schemas, drift windows, thresholds, ownership, alert routing, security, cost, and validation. For model-hosting choices, the SageMaker versus Bedrock inference guide explains why predictive models with custom monitoring often remain on SageMaker.
Meta-monitoring is different from endpoint monitoring
| Layer | Question | Typical signals |
|---|---|---|
| Infrastructure | Can the endpoint serve? | CPU/GPU, memory, invocation latency, 4xx/5xx |
| Data quality | Does production input resemble expected data? | Missing values, ranges, category mix, distribution drift |
| Model quality | Are predictions still correct? | ROC-AUC, precision, recall, RMSE, business loss |
| Fleet governance | Which models, owners, baselines, and risks need action? | Trend, threshold, age, deployment, lineage, unresolved alerts |
SageMaker Model Monitor and CloudWatch can serve endpoint-level needs. Meta-monitoring makes those results comparable across models and accountable to owners. It is a portfolio control plane, not a replacement for local alarms.
The AWS reference architecture uses SageMaker AI, SQS, Lambda, Athena, Apache Iceberg, EventBridge, SNS, Amazon Quick, and optionally MLflow and Evidently AI.
Build one immutable record identity
Each prediction needs an ID that survives asynchronous ground truth:
{
  "inference_id": "inf_01K1...",
  "model_package_arn": "arn:aws:sagemaker:us-east-1:111122223333:model-package/fraud/42",
  "endpoint_name": "fraud-prod",
  "request_timestamp": "2026-07-30T18:20:14.412Z",
  "features": {
    "amount": 742.18,
    "merchant_category": "electronics",
    "account_age_days": 94
  },
  "prediction": 1,
  "score": 0.884,
  "tenant_hash": "...",
  "schema_version": 3
}
Do not use a customer identifier as inference_id. Generate an opaque unique value. Keep direct personal data out of the monitoring table when aggregates and tokenized keys are sufficient.
The AWS sample deploys a custom inference handler that sends inference records to SQS. A Lambda function writes a batch of up to ten predictions, or whatever arrives within 30 seconds, to Athena Iceberg. That batching is a sample setting, not a mandatory service limit. Tune it from request volume, Lambda concurrency, Iceberg commit behavior, and acceptable delay.
Inference logging should not decide the customer response. Put the event onto a durable asynchronous path and return the prediction. If SQS is temporarily unavailable, choose explicitly whether the endpoint fails closed, buffers locally, or marks monitoring loss. Silent loss is the worst option.
Separate training, evaluation, inference, and labels
The sample uses five Iceberg tables around four important data roles:
| Dataset | Purpose | Mutability rule |
|---|---|---|
training_data |
Distribution the model learned from | Frozen snapshot referenced by baseline |
evaluation_data |
Held-out performance baseline | Frozen, stable 20% split |
inference_responses |
Production inputs and predictions | Append-only, partitioned by time/model |
ground_truth_updates |
Delayed confirmed outcomes | Append updates keyed by inference ID |
monitoring_responses |
Drift run results and lineage | Append one record per model/window/run |
AWS uses a deterministic hash of transaction_id to split 80% training and 20% evaluation. Re-running the seed step produces the same membership. That detail matters because a random evaluation slice makes baseline comparisons drift even when the model does not.
Pin the Iceberg snapshot IDs in a baseline.json artifact registered with the model:
{
  "model_package_arn": "arn:aws:sagemaker:us-east-1:111122223333:model-package/fraud/42",
  "training_snapshot_id": 918273645,
  "evaluation_snapshot_id": 918273901,
  "code_commit": "8f0e5c4...",
  "metrics": {
    "roc_auc": 0.921,
    "precision": 0.873,
    "recall": 0.806
  },
  "created_at": "2026-07-29T21:14:00Z"
}
The baseline belongs to the model package. Never keep one mutable current-baseline.json object for an entire endpoint.
Handle delayed ground truth as a first-class stream
Fraud labels may arrive after a chargeback or analyst review. Loan outcomes can take weeks. Forecast accuracy appears only after the forecast horizon. Monitoring must distinguish “incorrect” from “not labeled yet.”
Write ground truth to a separate table:
SELECT
  i.inference_id,
  i.model_package_arn,
  i.request_timestamp,
  i.prediction,
  i.score,
  g.actual,
  g.confirmed_at,
  date_diff('day', i.request_timestamp, g.confirmed_at) AS label_delay_days
FROM inference_responses i
JOIN ground_truth_updates g
  ON i.inference_id = g.inference_id
WHERE g.actual IS NOT NULL;
Track label coverage and delay distribution alongside quality. A sudden ROC-AUC improvement can be fake if only easy cases receive labels. Alert when labeled coverage drops or the population of labeled records differs from total inference traffic.
The AWS sample flips 15% of simulated labels to demonstrate model degradation. Do not copy that simulation into production. Replace notebook-generated inference and labels with real application and business processes.
Compute data drift and model drift independently
Data drift asks whether feature distributions changed. Model drift asks whether predictive performance changed after labels arrive.
| Check | Baseline | Current window | Example trigger |
|---|---|---|---|
| Data drift | Frozen training snapshot | Recent inference features | 20% or more features drifted |
| Model drift | Frozen evaluation snapshot | Labeled recent predictions | ROC-AUC falls by more than 0.05 |
The values above come from the AWS sample (DATA_DRIFT_THRESHOLD: 0.2 and a 0.05 ROC-AUC degradation example). They are starting points, not universal risk limits.
Evidently selects statistical tests based on column type and sample size. The reference discusses Kolmogorov-Smirnov or chi-square for smaller samples and Wasserstein or Jensen-Shannon distance at larger sizes. Statistical significance is not business impact. A highly trafficked endpoint can flag tiny harmless differences; a low-volume model can miss a meaningful shift.
Set thresholds from backtests:
- Replay several months of known-good production data.
- Inject realistic drift and failure scenarios.
- Measure detection delay and false-alert rate.
- Map each threshold to an owner and response.
- Recalibrate after model or business changes.
The AWS Glue data-quality anomaly guide applies a similar principle to cataloged datasets: anomaly detection needs a stable data contract and ownership, not just a score.
Choose the monitoring window from label physics
The sample configuration can use a one-day data-drift window and a model-drift window adjusted to label arrival. Its default notebook flow uses 30 days for model drift because ground truth may be delayed.
| Model class | Data window | Quality window | Reason |
|---|---|---|---|
| High-volume fraud score | Hours to one day | Rolling several days after labels | Fast input changes, delayed investigations |
| Credit decision | Days | Weeks or months | Outcomes mature slowly |
| Demand forecast | Daily | One or more forecast horizons | Accuracy is unknowable before horizon closes |
| Rare-event safety model | Weeks | Event-count window | Calendar windows may contain too few positives |
Use minimum sample sizes. When a window lacks enough labeled examples, report INSUFFICIENT_DATA rather than a green status. The dashboard should show coverage and sample count beside every metric.
Schedule computations without overlapping commits
EventBridge can invoke a container-based Lambda daily or at another cadence. Give each run an idempotency key:
model_package_arn + window_start + window_end + metric_version
Before writing monitoring_responses, check whether a completed record exists for that key. Use Iceberg transactions or a deterministic merge. If a retry writes the same run twice, fleet trends and alert counts become unreliable.
Bound Lambda runtime and memory from measured Athena query and Evidently workloads. Large feature tables may need a Glue, SageMaker Processing, or container job rather than Lambda. Serverless is a deployment choice, not a requirement of meta-monitoring.
Design the Amazon Quick dashboard for decisions
Amazon Quick combines research, insights, automation, and no-code application capabilities. The Amazon Quick user guide is the current product reference.
Build three dashboard levels:
Fleet view
- endpoints and model packages in scope;
- current status: healthy, warning, breach, insufficient data, or stale;
- owner, business tier, last deployment, last monitor run;
- label coverage and baseline age;
- open actions and SLA.
Model view
- data-drift feature ranking;
- quality metric trend with baseline and threshold;
- inference and labeled sample counts;
- endpoint latency/error overlays;
- model, code, and Iceberg lineage.
Investigation view
- run ID and exact window;
- changed features and test statistics;
- model package ARN and baseline snapshots;
- recent deployments and data-pipeline changes;
- links to MLflow run, CloudWatch, code commit, and runbook.
Do not use a single red/green score. Governance needs to distinguish performance breach, missing labels, stale monitor, data-pipeline failure, and unknown owner.
Route alerts by impact
The sample can publish notifications through SNS. Production routing should consider model criticality, persistence, and confidence:
| Condition | Response |
|---|---|
| One low-confidence feature drift | Dashboard annotation; no page |
| Persistent multi-feature drift | Data owner ticket |
| Quality threshold breach with adequate labels | Model owner page and rollback review |
| Monitoring run missing | Platform team page |
| Label coverage below minimum | Business process owner ticket |
| Critical regulated model stale | Governance escalation |
An alert must contain model package, endpoint, window, sample size, baseline, threshold, current value, run ID, owner, and recommended next step. “Drift detected” is not actionable.
For release decisions, borrow the explicit evaluation gates from the AgentCore evaluations CI/CD guide. Predictive metrics differ, but the evidence discipline is the same.
Secure the monitoring plane
Prediction logs can contain sensitive features and outcomes. Use:
- a VPC-enabled SageMaker domain and private endpoints where appropriate;
- distinct roles for training, inference logging, drift computation, dashboard ingestion, and operators;
- KMS encryption for S3, SQS, Iceberg data, logs, and secrets;
- Lake Formation or Athena workgroup controls for table access;
- row/column restrictions for tenant or regulated attributes;
- CloudTrail and query auditing;
- retention and deletion policies tied to the data classification.
Do not give dashboard viewers raw feature access merely because they need a drift percentage. Publish aggregates or curated views. Tokenize join keys and minimize captured payloads.
The Bedrock zero-data-retention controls target generative AI, but its organizational lesson applies here: data-handling promises need enforceable project, IAM, and logging boundaries.
For centralized telemetry controls, the CloudWatch auto-enablement guide shows how platform teams can enforce collection and ownership across accounts.
Govern ground-truth quality
Ground truth is not automatically true. Analyst decisions can disagree, fraud chargebacks can be reversed, labels can arrive late, and business policy can change the definition of a positive case. Model monitoring needs label provenance and revision handling.
Add these fields:
{
  "inference_id": "inf_01K1...",
  "actual": 1,
  "label_source": "fraud-case-system",
  "label_policy_version": "2026-07",
  "confirmed_at": "2026-08-04T13:10:00Z",
  "label_revision": 2,
  "supersedes_revision": 1,
  "confidence": "confirmed"
}
Do not overwrite earlier labels in place. Append a revision and have monitoring select the latest valid label as of the run’s cutoff time. This preserves reproducibility: a historical drift run can be reconstructed with the label state it used.
Monitor inter-reviewer agreement for human labels, reversal rate, coverage by segment, and label delay. A drop in model quality concentrated in one label-policy version may reflect a business-rule change rather than model decay.
Keep training and monitoring from leaking future outcomes. A baseline built with labels unavailable at deployment time can make production comparison unrealistically strong.
Version the metric implementation
Changing Evidently, a statistical test, feature preprocessing, null handling, or a threshold changes the meaning of a monitoring result. Store metric_version and dependency versions in monitoring_responses.
metric_version: fraud-drift-4
evidently_version: pinned-in-image
feature_schema: 3
null_policy: explicit_category
data_drift_threshold: 0.20
model_metric: roc_auc
model_degradation_threshold: 0.05
minimum_samples: 10000
When the metric changes, run old and new implementations over the same historical windows. Publish the comparison and choose a cutover date. Do not draw one continuous trend line across incompatible definitions without an annotation.
Pin the monitoring container digest. A floating dependency update that changes statistical defaults can create fleet-wide alarms unrelated to any model or data change.
Build a drift-response runbook
An alert should lead to a bounded investigation:
- Confirm monitoring freshness, sample size, label coverage, and metric version.
- Compare infrastructure health and recent endpoint deployments.
- Identify which features, segments, or labels moved.
- Check upstream data-pipeline and business-policy changes.
- Reproduce the metric from the pinned snapshots and window.
- Decide: observe, repair data, adjust threshold with evidence, retrain, or roll back.
- Record the outcome and add a regression scenario.
| Finding | Likely action |
|---|---|
| Input drift, quality stable | Observe or retrain proactively based on risk |
| Quality degrades, input stable | Check concept drift, labels, code, and endpoint version |
| Both drift | Inspect upstream population shift and model suitability |
| Quality alert with low label coverage | Fix label pipeline before model decision |
| Many models alert simultaneously | Investigate shared data or metric pipeline |
Rollback only when a previous model is compatible with current inputs and demonstrably performs better. A population shift can make the old model worse too. Keep a shadow evaluation against the previous model package where cost and risk justify it.
Manage a model’s retirement
When an endpoint is deleted, close the monitoring lifecycle deliberately. Record the final model package, last inference timestamp, unresolved alerts, data retention policy, and replacement model. Disable schedules only after late ground truth no longer needs processing.
Preserve baseline and monitoring evidence for the required audit period. Delete raw features sooner when policy allows and retain aggregates plus hashes. Remove dashboard tiles or mark them retired; stale green models are misleading.
A fleet registry should reconcile SageMaker endpoints, Model Registry packages, monitoring contracts, EventBridge schedules, Quick assets, and owners. Alert on orphan endpoints without monitors and monitors whose endpoints no longer exist.
Control cost with table and query design
The monitoring plane adds endpoint logging, SQS, Lambda or compute, S3, Iceberg commits, Athena scans, Quick usage, CloudWatch, and optional MLflow costs. Control them by:
- partitioning inference and monitor tables by date and model identity;
- selecting required columns instead of scanning nested payloads;
- compacting small files and expiring snapshots under retention policy;
- aggregating dashboard datasets rather than querying raw inference repeatedly;
- using per-model cadence based on risk and traffic;
- sampling high-volume payloads while retaining complete counts and outcomes where statistically valid.
Track cost per one million inferences monitored and per governed endpoint. A fleet layer should make ownership visible, including its own cost.
Roll out one model at a time
Start with a high-volume model whose ground truth arrives within days. Run the meta-monitor in shadow mode for several historical windows. Compare its findings with what the model team already knows. Fix lineage and label gaps before tuning thresholds.
Then onboard models through a contract:
model_owner: [email protected]
business_tier: critical
endpoint: fraud-prod
model_package_group: fraud-classifier
prediction_schema: 3
label_source: chargeback-confirmations
minimum_labeled_samples: 10000
data_window_days: 1
quality_window_days: 30
quality_metric: roc_auc
max_degradation: 0.05
runbook: runbooks/fraud-model-drift.md
Reject onboarding if ownership, labels, baseline snapshot, or rollback path is missing. A dashboard tile without those fields is monitoring theater.
Know when the architecture is too much
Use meta-monitoring when several predictive endpoints need comparable governance, delayed ground truth, lineage, and shared ownership. Keep endpoint-local monitoring when one small model has immediate labels and an existing team dashboard. Do not centralize every raw feature simply to build a fleet view; publish minimal standardized monitoring records.
Make the governance view useful during an audit
For every breached window, retain the metric definition, threshold version, sample counts, label completeness, baseline snapshot, model package, endpoint configuration, code revision, and disposition. The dashboard may remain a convenient entry point, but the underlying record must stand on its own after a visual or dataset changes.
Test this by selecting an old alert and asking a reviewer who did not build the system to reconstruct the decision. They should determine what changed, which comparison was used, who acknowledged it, whether deployment was paused, and why service later resumed. If the answer depends on somebody’s memory or a mutable chart, the evidence chain is incomplete.
Apply retention based on business and regulatory need, and minimize captured prediction content. Governance requires lineage and decision evidence; it does not automatically require preserving every feature value or customer payload. Store stable identifiers and aggregates when they can answer the operational question with less exposure.
The strongest part of this architecture is the immutable link between deployed model, code, data snapshots, and production window. Build that lineage first. Once every metric can answer “compared with exactly what?”, Amazon Quick can turn the records into a useful operating view instead of another dashboard nobody trusts.
Sources
Explore more like this

Cloud IoT Security: Zero Trust, Identity, and Signed Updates
On September 11, 2026, the Cyber Resilience Act’s incident-reporting rules start applying in the European Union. That is 22 days after this article’s publication date. A manufacturer that learns of...

Kill the Docker Hub Token: OIDC Trust for GitHub Actions
On July 31, 2026, Docker shipped OIDC connections for GitHub Actions to any organization on a Docker Team, Docker Business, or Docker Hardened Images subscription, plus organizations in the Docker-Sponsored...

Bedrock Web Search: Grounding an Agent Without Building a Scraper
On August 4, 2026, AWS made Web Search on Amazon Bedrock generally available, and the entire integration surface is one JSON object: {"type": "web_search"}. That is the whole change from...

Comments